fbpx

General Electric Is Currently Overbought


Since the beginning of the year, $GE bulls have been actively trading with over 250points. 2018 ended on a poor note for $GE shares when price fell about 500points before a range in price began. However, 2019 began with the $GE bulls in charge of the market with over 150points gained before the end of January. On the 1st of February 2019, they was a gap upwards which made the share price of $GE to move higher about 100points more.

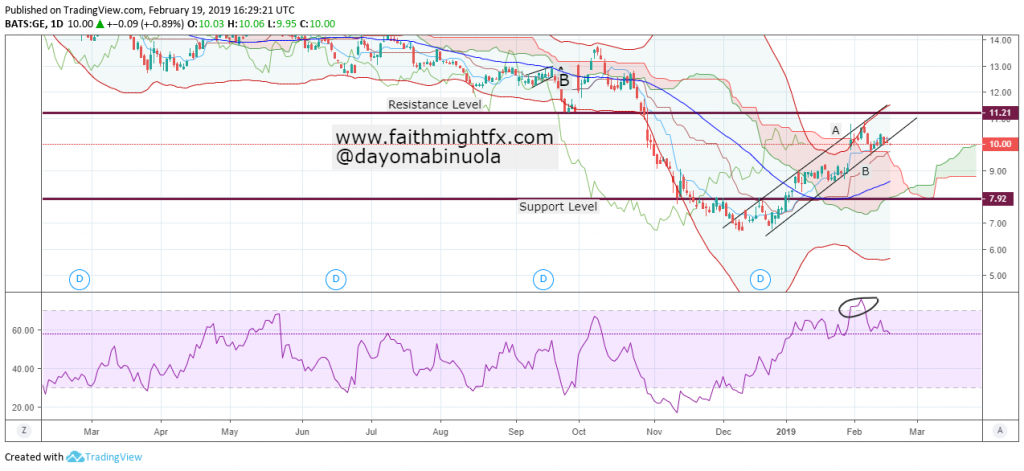
Price is already overbought using the RSI thereby depicting a reversal is about to begin. Ichimoku is still showing a bullish direction alongside the price of $GE still on the upper region of the Bollinger bands. As it is expected that the bears get into the market for a short while, price of $GE could begin a bullish movement after a dip might reach 8.50.

Nike Bulls May Relent

There has been an upward movement with the $NKE share price since the last week in 2018. The bulls have gained about 300points since then. $NKE reached an all time high in September 2018 and there was a major resistance at 86.04 level. The current price of $NKE is at 85.07 which might maintain the resistance level 86.04. Just recently, $NKE trainers which looked to have the name Allah have been asked to be recalled. This recall may negatively affect the sales of the trainers.

Ichimoku’s future is yet to show a reversal which indicates that the $NKE bulls are still in the market. RSI also shows an overbought position indicating that a correction lower may begin. Since price is already touching the resistance level, this could give room for the bears to get into the market. Price of $NKE still maintains the upper region of the Bollinger bands. If a bearish movement begins, it could attract about 100points.

Source: Nike Air Max Trainers Allah Sneakers Recall Petition Arabic Offensive.
(Independent.co.uk)

Netflix Retesting Resistance

Netflix share price attained all time high in June 2018 with a profit gain of over 100% for all of 2018. After this height, a fall in share price began from 422.77 to 232.78. About 45% fall in price turned the stock bearish in the 2nd half of 2018. Bulls have been more active in 2019 with $NFLX gaining about 100 points. On the third trading day of the year, price had already moved up to the upper section of the Bollinger bands.


Price of $NFLX has since retested support level before the bounce; price is currently around the resistance level. A breakout of the trendlines to the downside has occurred making $NFLX to drop in share price. The drop might continue if more sellers get into the market. However, the candlesticks are yet to cross to the lower section of the bands indicating price is still in the buying region. Ichimoku is yet to change direction from its bullish side to being bearish. Nevertheless, RSI has shown that price of $NFLX is currently overbought. Price might fall over 30points depending on the activities of $NFLX sellers.

Facebook Bears Might Be Getting Out Of The Market

The second half of 2018 went sour for Facebook investors when a long dip began in July. Share price moved upward to reach 218.11 and fell to 123.25. $FB has enjoyed a smooth ride in the past few years without much hassle until the dip. The fall was at 43.5% which was the worst fall in the history of $FB shares. Most of the stocks in the market fell towards the end of 2018. Technically, an M sign has been formed holding on to a strong support at 123.25.


RSI is currently showing oversold. This oversold position was last reached in 2012. If $FB bulls get into the market amass, this could lead to a change of trend in the bullish direction. The share price of $FB might reach 160 from its current 145.97 when the bulls take charge fully. A breakout of the resistance level might make the bullish movement to continue. Though Ichimoku is yet to give a change of trend, price might also get into range before the uptrend begins.

Hope For Apple Bulls

$AAPL lost all its gains in 2018 starting in November. This might be due to the on-going trade wars. Since this fall in price, $AAPL shares reached 145.82. Before the huge fall in $AAPL share price, it had been overbought a few times. Using the weekly chart, price of $AAPL has been in the upper region of the Bollinger bands since August 2016 before it changed to the lower section of the bands in November 2018. $AAPL reached an all time high of 228.39 in September 2018.


The fall in $AAPL share price made the RSI show an oversold position. The trendlines are already broken showing a bullish reversal. Though price sits comfortably in the lower region of the Bollinger bands, it is yet to fully reverse. From now, the activities of buyers might make the $AAPL shares to rise to 188.07 from its current 155.17. Ichimoku’s future still shows price is on the downtrend. However, the support level 145.82 is yet to be broken downward despite price retesting the level in the past four weeks. This could be an indication that $AAPL bulls are about to launch their efforts.

Wells Fargo Could Be On The Rise

The share price of $WFC went down in 2018 for about 2100 points. It was not really a good year for investors of $WFC. A support level at 43.46 was last reached in October 2016. In the last month of 2018, it was all bearish for the $WFC shares though the bears have been in charge since September. An oversold position has been reached which might give room for investors to take charge. 2019 began with an obvious movement of the $WFC shares in favour of the bulls. Though, there are a few signs that the bulls have been active in the market in the last days of 2018.

Wells Fargo stock daily chart


The oversold levels were reached in December 2018 using the RSI. The quest for the $WFC shares to go bullish might have begun already because about 400points have been gained on the $WFC shares so far this year. Price is currently at 48.70. Stocks are beginning to gather momentum generally for bullish movements. There are very high tendencies that the price of $WFC will touch the resistance level 1 at 50.13 and eventually breaks the resistance.

For Procter & Gamble, The Bulls Might Give Up Soon

After a experiencing a huge fall early in the year, the price of $PG gained momentum for a rise in June. Since June, it has all been bullish for the $PG shares, moving over 2000points in 2018. Just two weeks ago, the price of $PG reached 94.88, the highest point in the year. Though a bearish movement occurred in the second week of October for a short while, the bulls took over again. Price is yet to be oversold due to the active roles of the bulls.

Unlike many other stocks, $PG finished October with the bulls in charge. Price is currently at 91.94. After the new high of 2018 was reached, a reversal has begun indicating a bearish move in $PG. Price is yet to cross the lower region of the Bollinger band. The Ichimoku too shows a bullish future. However, a breakout to the downside has occurred from the trendlines showing the beginning of a correction. RSI indicates an overbought position which has previously occurred at three different instances. Though $PG outperformed this year, price action now signals a consolidation period that could lead to losses.

Source: Why Procter And Gamble Is Now All The Rage On Wall Street (NASDAQ)

Are The Wal-Mart Bears Trying To Overpower The Bulls?

In the year 2018, $WMT share price has been stable for the most part with a few volatile moments occurring in price movement. The all-time high of $WMT was in January when price was at level 109.79. Price had dropped since then to around 81.82 which stands as a major support level for the year. Unlike other stocks in October, $WMT broke out of a ranging market to begin an uptrend. Before the upward breakout in October, there was a bullish signal in August.


The RSI on the daily chart showed an initially overbought position and now in November, showing another overbought position. Since price crossed over to the upper region of the Bollinger band in June, it is yet to cross to the lower region. In the early days of October, price touched in the middle line of the Bollinger bands. If the support level is broken, it might trigger a major sell off for $WMT stock. The bearish movement might reach 88.94 from 101.33. Indications show a strong bearish movement might occur. For now, we will wait to see what price will do.

Google Retesting Support

$GOOG has found support at 1001.23 on the 29th of October. The bears have been in charge of this stock since the first week of September. Price action this year shows support level at 1001 was not broken. Share price of $GOOG fell about 3.5% this week. Since a major downtrend began in October, share price of $GOOG has dropped 14.2%. Price has maintained the lower region of the Bollinger bands since September. It’s like all the gains of $GOOG in 2018 were lost between September and October.


RSI on the daily chart signals an oversold region. Taking a look at the trendlines And B, price closedabove the trendline B on the 7th of November. Presently, price is retesting at a major support indicating a reversal. Price might touch the resistance level at 1123.23 this month. Ichimoku shows a downtrend and no trace yet. If price retraces but holds the expected resistance level at line C, $GOOG may continue the downward trend.