fbpx

ExxonMobil Reaches New High Since 2016

Any investor who bought Exxon Mobil shares in November 2020, which at the time was $31.07, would have recorded a continuous gain because the $XOM share price has been bullish since the 2020 global lockdown was eased. This bullish run that began towards the end of 2020 was activated by the double bottom in March 2020 and November 2020.

Daily Chart

The share price of ExxonMobil didn’t make any significant movement in the year 2021 as prices range for most of the year between $52.14 and $66.09. Exxon Mobil’s share price opened for the month of March 2022 at $78. But the share price shot up to $91 on the 8th of March 2022. This spike is a result of crude oil prices reaching a new high of $130 per barrel.

Weekly Chart

After the price of Exxon Mobil reached $91, which is the highest since 2016, a gap down occurred and the gap down is yet to be filled. Just yesterday (March 10, 2022), crude oil price dropped 12% as the price fell from $123 per barrel to $108 per barrel. This recent spike in Exxon Mobil’s share price might continue if the crude oil price finds its bullish momentum and continues its rally. RSI has indicated overbought positions at two different times between January and March. In the coming months, a dip to $60 might occur.

Some of these ideas are in our clients’ portfolios. To understand if this one can work for you or for help to invest your own wealth, talk to our advisors at FM Capital Group. Would you like more information on how to get stocks in your portfolio? Schedule a meeting with us here.

Exxon Mobil To Continue Its Trend

Undoubtedly, the year has been very good for the Exxon Mobil share price. Though in 2018, it was a rowdy chart with a majorly ranging market. The year has all been bullish for the $XOM from 71.25 to its current 82.90. The last time RSI showed either overbought or oversold region was in July 2017. The first resistance level has been reached at level 81.88. There might have been several looks of a reversal in price but as it appears, the bullish movement might continue.

Exxon Mobil Weekly Chart

We might expect price to reach 88.16 which is the second resistance level. Unlike last year, there is a lower number of ranging markets in the $XOM market with the bulls more active. The Ichimoku’s future has already shown a bullish signal which might be an indication for the bulls to continue trading. If price touches the second resistance level, by this time, the RSI might show an overbought position.

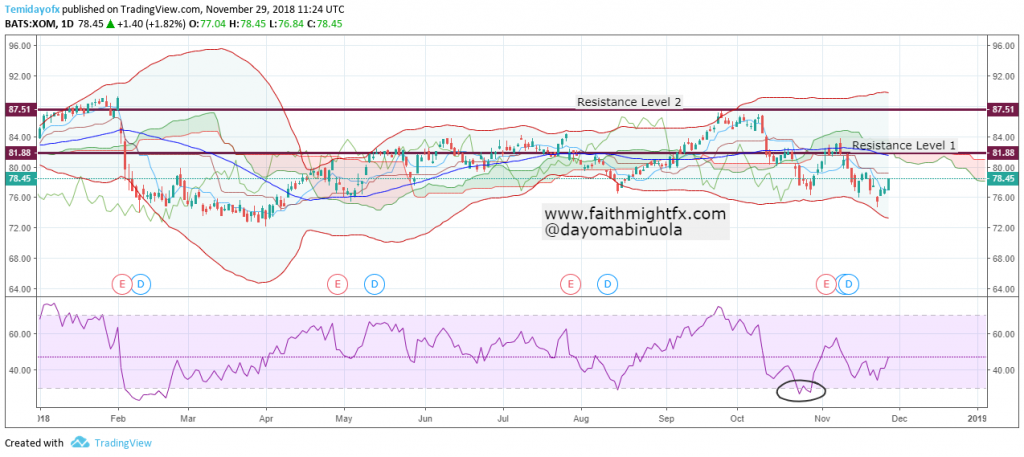
Exxon Mobil Finding A New Resistance

The Exxon Mobil shares in 2018 has been of low volatility with several higher lows and lower highs. Price of $XOM had initially broken support in February leading to a fall in price. The highest point of $XOM price in 2018 was at 89.32 which was in February; then the bearish movement made price to reach 72.71, the lowest level in the year. The highest rate of volatility of $XOM shares was in the first quarter of the year. Price action shows a long range in price from April to mid September. Both the bullish and bearish movement within the range period were between 700points. The second resistance level in the year, 87.51 was only reached once in September after a bullish movement broke out from the range.

In September, when the price of $XOM reached an overbought position on the RSI, a reversal began. This reversal gave rise to price breaking the support level at 81.88. Price has since then been in the lower region of the Bollinger band. Price tried to retest back to the middle Bollinger band line which also stands as the resistance level. Price of $XOM is currently at 78.45, showing a trace of a bullish movement from the last 3 trading days. A breakout of the resistance level 1 at 81.88 could lead to a continuous bullish movement which might eventually reach 87.51. Investors might decide to go long on the $XOM since price is around a major support level in the year.