In 2018, the $EURCHF from the weekly chart shows a downtrend. In the penultimate year, $EURCHF shows an uptrend after a range in 2016. $EURCHF moved from the highest level 1.9805 in April 2018 to the lowest level 1.11901 in September 2018. The Swiss Franc gained over 8000pips against the Euro in 2018. Since the second half of 2018, $EURCHF has neither broken the support level 1.11901 nor the resistance level at 1.15031. $EURCHF’s average movement since July 2018 has been 300pips.
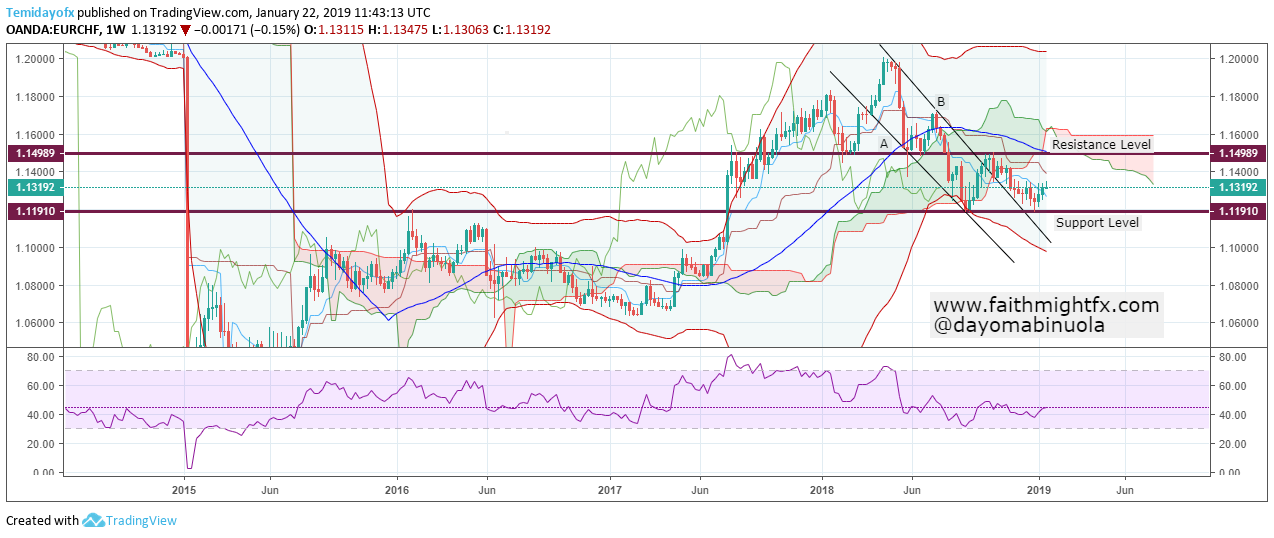
An upward breakout of the resistance level could begin if many more EUR buyers get into the market. Since the beginning of this year, the $EURCHF has begun a bullish trend which might reach the resistance level 1.15031. The trendlines A and B have been broken though $EURCHF is yet to move to the upper region of the Bollinger band. The $EURCHF despite the bearish movement last year, it is yet to be oversold. There is a double-buttom on the weekly chart at the support level which technically signifies a bullish movement may begin. A reversal might occur due to EUR buyers getting into the market.