$AAPL lost all its gains in 2018 starting in November. This might be due to the on-going trade wars. Since this fall in price, $AAPL shares reached 145.82. Before the huge fall in $AAPL share price, it had been overbought a few times. Using the weekly chart, price of $AAPL has been in the upper region of the Bollinger bands since August 2016 before it changed to the lower section of the bands in November 2018. $AAPL reached an all time high of 228.39 in September 2018.
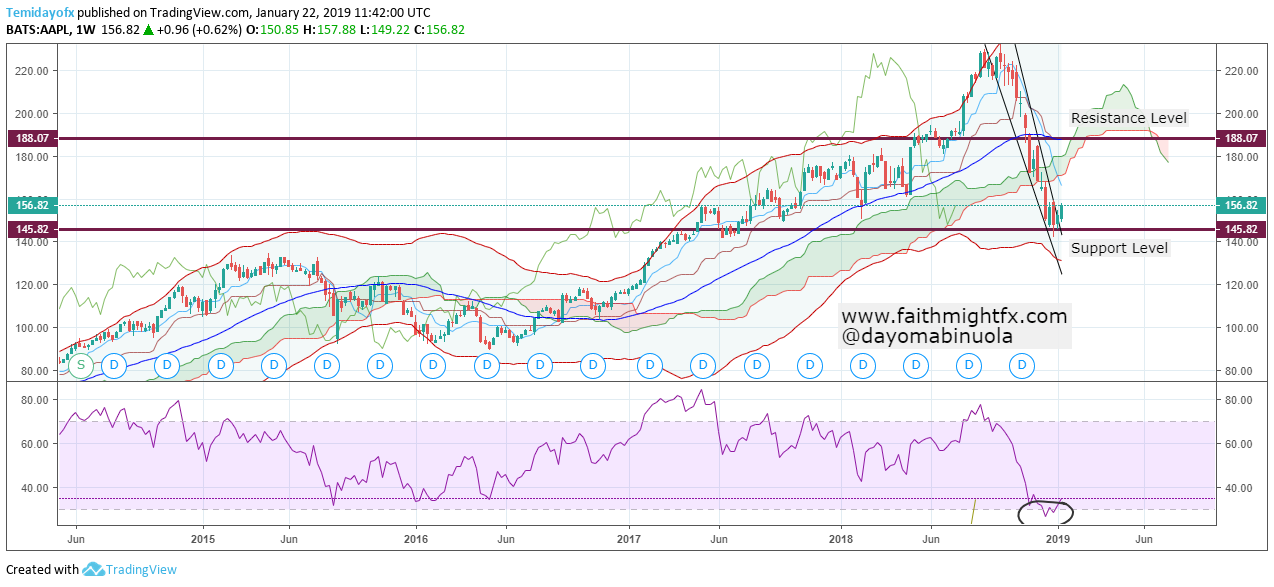
The fall in $AAPL share price made the RSI show an oversold position. The trendlines are already broken showing a bullish reversal. Though price sits comfortably in the lower region of the Bollinger bands, it is yet to fully reverse. From now, the activities of buyers might make the $AAPL shares to rise to 188.07 from its current 155.17. Ichimoku’s future still shows price is on the downtrend. However, the support level 145.82 is yet to be broken downward despite price retesting the level in the past four weeks. This could be an indication that $AAPL bulls are about to launch their efforts.