A resistance level of 103.95 was reached on the 25th of April 2019. For the most part of 2019, the Walmart bulls have been in charge of the market . A gap down occurred on the 26th of April, after which a temporary correction occurred. There was a very low volatility in the price movement of $WMT from mid February to the end of March. The share price of Walmart is beginning to drop after a bounce downward occurred at the resistance level.
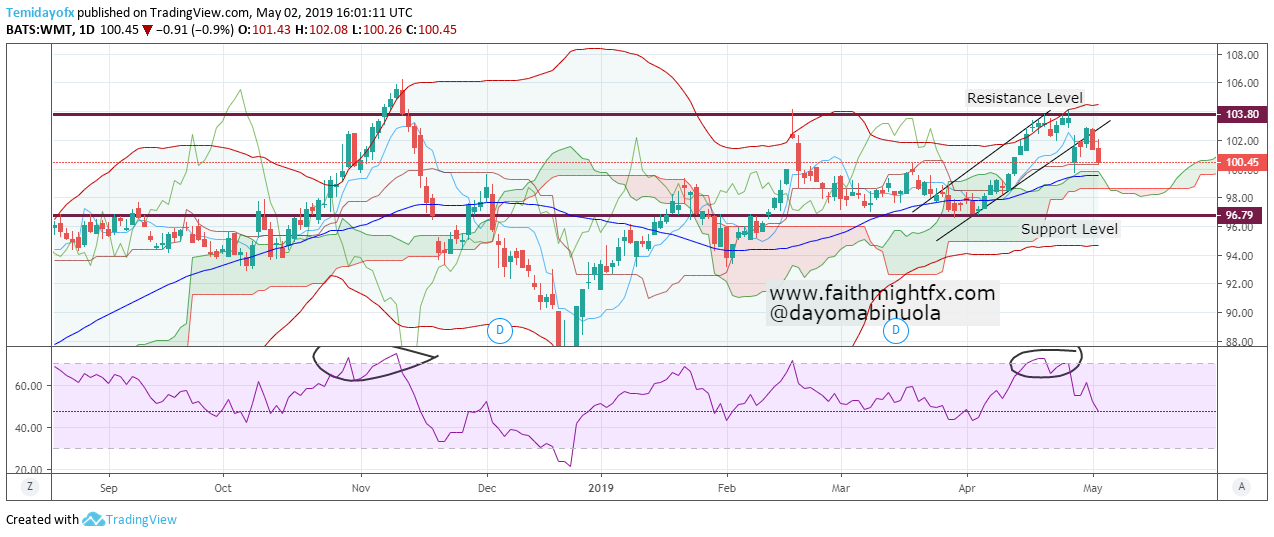
A breakout from the trendlines occurred to the downside which also complements other indications that the price of $WMT has begun a downtrend. RSI has been able to show an overbought position on the chart. The future of Ichimoku shows the $WMT bulls are still in charge of the market. Also, price maintains the upper part of the Bollinger band, which is yet to cross lower. The bears are gradually taking charge of the market.