Back in January, Bay Street opened a new position in $TSLA at around $496 for its Lens of History fund. It had just made a new all-time high at the time. I didn’t like the price because I personally prefer to enter on a correction but making new all-time highs tends to be a rare exception to this rule. $TSLA went on to skyrocket to more all-time highs running all the way up to $968.99 in just 6 weeks.
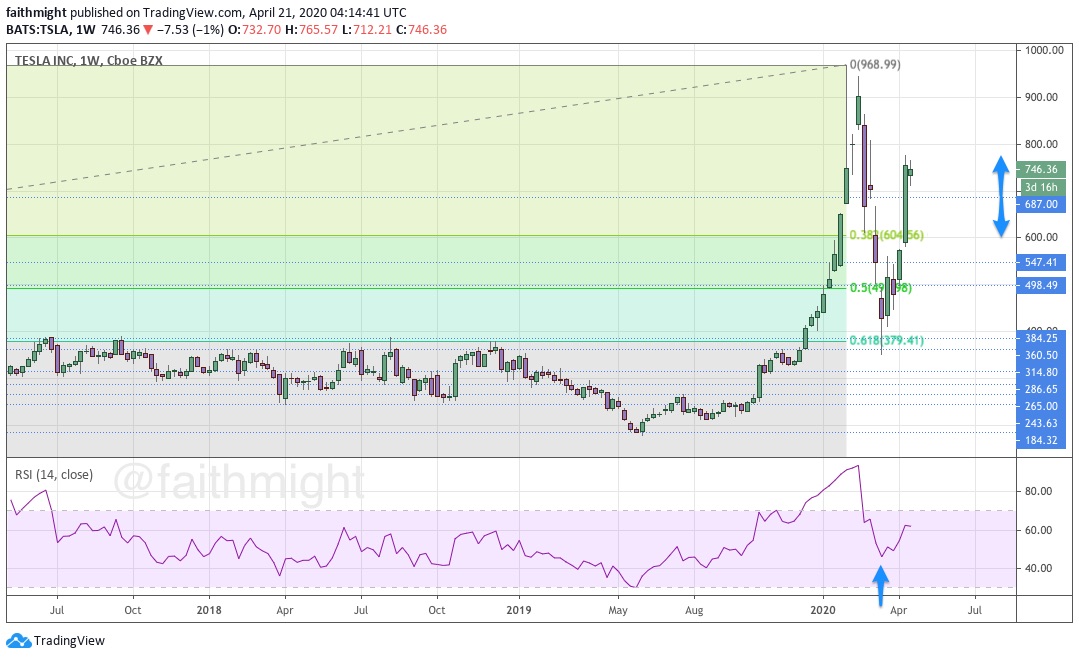
Looking at the RSI, $TSLA was extremely overbought that entire 6-week run up. Then the coronavirus hit the United States and spooked U.S. equity markets sparking a selloff in everything. Not even $TSLA was not spared. But what is interesting is that while the correction in price was a very deep one, just past the 68.1% Fibonacci level, the correction in the RSI was not. Momentum never stayed bearish even in the midst of that vicious selloff in price.
Since finding a bottom at the support zone between $360.60-$384.25, price has rallied quite nicely signaling a move back to new highs. However, next week on the 29th, Tesla will be reporting first quarter earnings after the market close. We will be watching that report closely for future direction in price from here.
If you are interested in learning how I found these levels, please check out the CHARTS101 or CHART201 course. Read the charts for your Self so you can trade what you see and not what I think.