There are times when markets just move so beautifully. Using the Fibonacci retracement and Fibonacci extension levels, we identified our entry point and our target and entered a short when price moved into the 38.2% Fibonacci level at 0.9116.
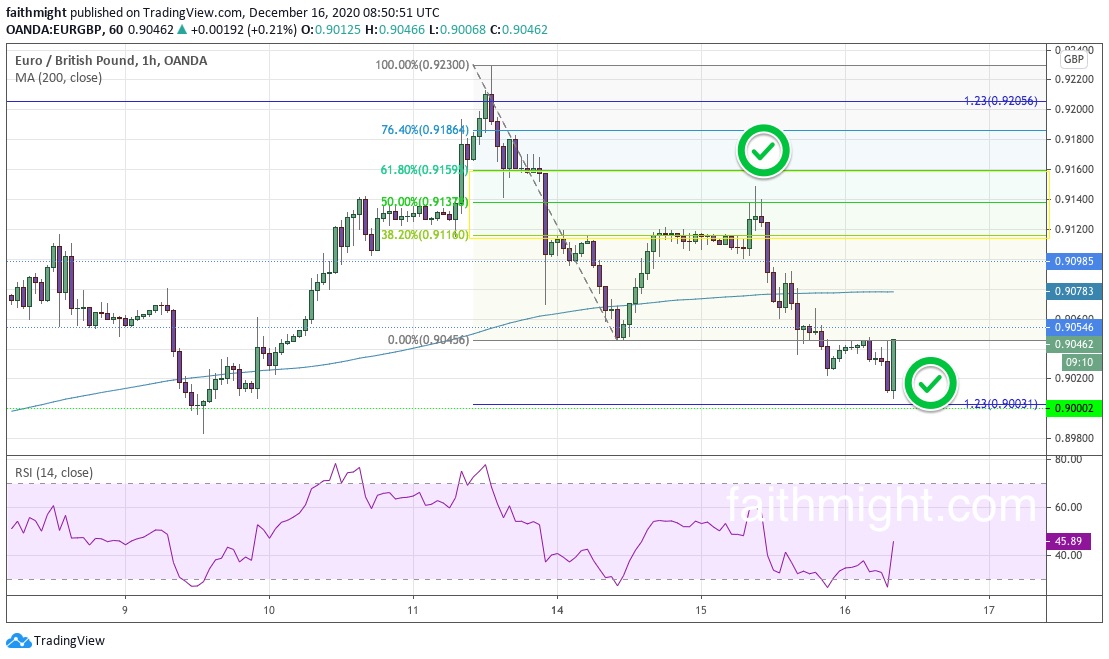
Starting the new trading week dropping from the 0.9230 highs of last week, the strong momentum evidenced in the RSI signaled to me that the strong rally had, indeed, ended. Instead of chasing the move lower, I took advantage of the correction higher when price bounced from 0.9045. With the risk clearly defined by the Fibonacci levels, I was comfortable with the short. Plus, the market seemed to believe that despite the hard negotiations the UK will get a favorable deal from Brexit.
Since then, the $EURGBP continued its descent towards the 123% Fibonacci extension level where I had my target. Price fell to that level before finding support this morning on the back of a economic double whammy of strong EU PMI data and weak UK CPI.
I wanted to show this trade as a learning example of how to read charts and use a few indicators to make good trading decisions. If you are interested in learning how to do fundamental analysis and find levels in your trading, please check out the CHARTS101 course. Read the charts for yourself so you can trade what you see and not what I think.
Read More:
- Pound rises on reports of Brexit-deal progress (MarketWatch)