fbpx

Are The Wal-Mart Bears Trying To Overpower The Bulls?

In the year 2018, $WMT share price has been stable for the most part with a few volatile moments occurring in price movement. The all-time high of $WMT was in January when price was at level 109.79. Price had dropped since then to around 81.82 which stands as a major support level for the year. Unlike other stocks in October, $WMT broke out of a ranging market to begin an uptrend. Before the upward breakout in October, there was a bullish signal in August.


The RSI on the daily chart showed an initially overbought position and now in November, showing another overbought position. Since price crossed over to the upper region of the Bollinger band in June, it is yet to cross to the lower region. In the early days of October, price touched in the middle line of the Bollinger bands. If the support level is broken, it might trigger a major sell off for $WMT stock. The bearish movement might reach 88.94 from 101.33. Indications show a strong bearish movement might occur. For now, we will wait to see what price will do.

Google Retesting Support

$GOOG has found support at 1001.23 on the 29th of October. The bears have been in charge of this stock since the first week of September. Price action this year shows support level at 1001 was not broken. Share price of $GOOG fell about 3.5% this week. Since a major downtrend began in October, share price of $GOOG has dropped 14.2%. Price has maintained the lower region of the Bollinger bands since September. It’s like all the gains of $GOOG in 2018 were lost between September and October.


RSI on the daily chart signals an oversold region. Taking a look at the trendlines And B, price closedabove the trendline B on the 7th of November. Presently, price is retesting at a major support indicating a reversal. Price might touch the resistance level at 1123.23 this month. Ichimoku shows a downtrend and no trace yet. If price retraces but holds the expected resistance level at line C, $GOOG may continue the downward trend.

Sony Couldn’t Break Support After Finding New Resistance

This year, $SNE has been in an uptrend. In June, the price of $SNE was clearly moving in the upper region of the Bollinger bands for over 1000 points. In September, it found resistance at 60.99, the all-time high from April 2007. Then the early days of October brought about a sharp downturn of about 800 points.

A breakout from the trendlines has occurred, which may signal a bullish movement. Price still maintains the lower part of the band despite the breakout. The Senkou span of the Ichimoku shows a downtrend. RSI indicates an oversold position in the market. Price might reach 58.19 from 55.26 as at the time of this writing. Sony is expected to make a big profit jump due to their winning game strategy. A breakout from the expected 58.19 level could make $SNE resume the upward trend.

Source: Sony Forecasts Big Jump To Record Annual profit On Winning Gaming Strategy-(Reuters.com)

Bank Of America Gaining Strength After A Fall In Market Price

The market value of $BAC worsened in September reaching 25.99 from 30.12. Price rallied majorly between 29.41 and 31.99 throughout this year. $BAC has maintained stability in market price for the most part of 2018. After a fall in price in September, price reached a new low since mid-November 2017. Price movement this year reached 33.05 in March making it the highest price point of $BAC reached since the financial crisis in 2008. Investors might have been undergoing discomfort during the times the market was in a range. In July, price gave a signal of a future downtrend which later occurred in September with over 400 points.


More investors bought shares of $BofA after a new support level was reached in October. Over 100 points was gathered last week when buyers resumed. The RSI on the daily chart shows price has been oversold. If more buyers come on board, price might reach a new resistance at 29.41. Eventually, if price goes up and moves beyond the first resistance level, price might reach 31.00. Though price movement is in the lower region of the band, it could continue higher if price closes above the upper region of the band, it could continue the bullish movement.

JP Morgan Chase Holds Still Support

The price of $JPM found solace around 102.90 level at support and 119.21 level at resistance in 2018. This is a price movement of about 1800 points. That is a whole lot of profits for long term traders. However, the price movement of $JPM in the first half of the year was not good for bulls until July.

$JPM DAILY CHART

A breakout has occurred from the trendlines. This could be an indication for a bullish movement. Price is presently at 109.25 level and might reach 112.75. The RSI never fails in showing us when it is oversold so it may signal another buy in $JPM shares. Price movement to the upper part of the Bollinger bands may show a continuation in upward trend. Ichimoku gives no trace yet for a reversal in price of $JPM. A breakout of price occurred also from the resistance level. Price may move as high as 119.21, which is a major resistance level for this year.

Nikkei About To Begin A Bullish Trend

October was not too good for Nikkei. The stocks began a downtrend moving over 3000 points. That’s a big loss for the stocks in $NKY. The highest level $NKY reached in 2018 was at 24372. This level was reached in the early days of October where RSI showed us an overbought region. This gave rise to a reversal. For the most part, the $NKY, in 2018, is dominated by sideways movement on the daily time frame. Having been oversold from the downtrend in the latter days of October, price was at 21067 level. The last time price got to 21067 was in March 2018.

The Senkou Span from Ichimoku shows a downtrend future, but has yet to show a reversal signal. RSI shows an oversold region at 21067. Price of $NKY already touched the lower Bollinger band line thereby leading to a bounce upward. Using the price movement on the trendlines, price already broke out, which indicates a bullish trend is about to begin. This bullish movement might touch the middle line of the band which is at level 22821. From now, price of $NKY might generate over 1000 points from 21700 to 22821.

Facebook is Done

I love Facebook. I connect with my tribe there every day and it is fabulous. But I am completely over $FB, for a few reasons:

  1. People are leaving Facebook. While people are always leaving Facebook for one reason or another, the exodus never eclipsed the number of new people and businesses that signed up every day. Last quarter, Facebook reported a decline in users for the first time ever. And they warned that they expect that decline to continue. With 2 billion users on Facebook and a population of 7 billion on the Earth, how many more users can it really get at this point?
  2. History has shown that election season tends to be very lucrative for Facebook. But thanks to Cambridge Analytica, don’t be surprised if they see an actual decrease in revenue during this election cycle. If the market is surprised, it won’t be in a good way.
  3. I’ve been side eying $FB stock since the Cambridge Analytica fiasco anyway. But $FB hit $200 twice after that. So when the stock started to dip again, I knew there was real weakness. But thinking of all the mutual funds and hedge funds that hold this stock, I thought it would get back to $200 as they buy more shares on this dip too. With stock markets moving higher and higher all year despite trump and tariffs, I didn’t foresee rising interest rates to be the eventual catalyst for a decline in equity markets. I’m paying more attention to that as rates will go higher.

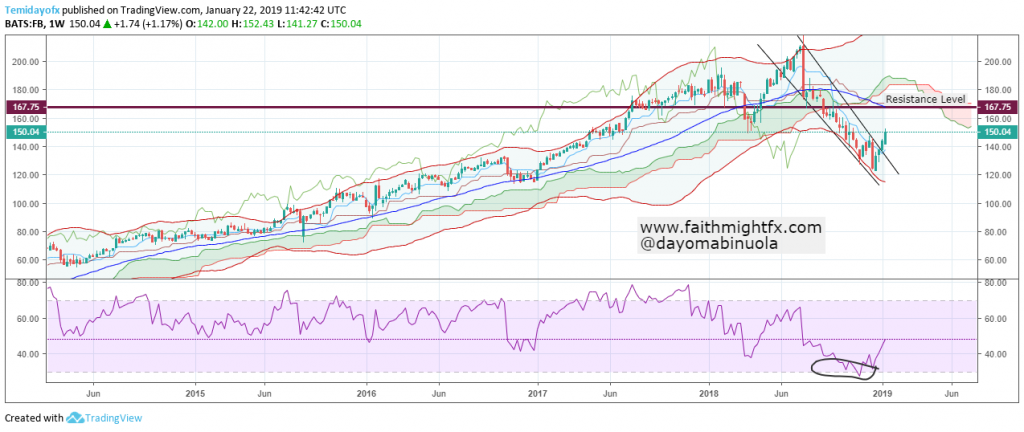
FB WEEKLY CHART AS OF TODAY

Read our work on $FB this year. We have been skeptical all year and current price action continues to confirm our sentiment.  Before the earnings report was released yesterday, $FB made new lows for the year at $139.03. While this may be new lows, it is also a 38.2% Fibonacci retracement so the post-earnings bounce is a move we were watching for. The question is now the follow through higher, which is expected on a Fibonacci move. However, the aforementioned reasons could see a failed high before we see a new high.

There are ebbs and flows to every market. Trade what you see. Or learn with me. And invest with a pro. [sponsored]

Sources: What’s behind Wednesday’s market selloff?
(NPR)

FTSE 100 Awaiting A Breakout Confirmation

The movement of $FTSE 100 has been between 7900 and 6900 this year. During this time, $FTSE 100 reached an all- time high in May at 7900. Several stocks in the US this year reached an all-time high. In the first quarter of the year, more sellers traded $FTSE 100. Towards the end of the first quarter, a breakout occurred which made price remain bullish till June. After this, a long-term range began. Later in August, a breakout downward occurred on the daily chart. Price reached 7290 and bounced upwards to touch the middle Bollinger bands line. Price went further down and broke out the support level, forming a new support level at 6924.

FTSE CHART

Recently, RSI showed oversold when price reached that new support level at 6924. Since August, when price of $FTSE 100 comfortably closed below in the lower section of the Bollinger bands, price never closed in the upper band. An expectation of about 200 pips upward might be realised on $FTSE 100 trades soon. Indications from the trendlines show a breakout already occurred while price remains in a range. The future resistance level is expected at 7277. Ichimoku has not shown a trace of a reversal but the bull gangs might push the price of $FTSE 100 upwards.

Overbought Positions, Yet USDJPY Price Remains Bullish

A major Bullish trend began in March 2018. About 800 pips have moved in favour of the USD pushing the $USDJY higher. The USD remains quite strong in 2018. There has been a major break in the uptrend in May, price only moved downwards from 111.149 to 108.412 before the uptrend continued to new highs at 114.488.

Price action disobeyed the rules of RSI: price has shown overbought positions three times between May and October, and each time the upward movement continued. Could this be the monetary policies made this year, that has favoured the USD? Price is around 112.631 hoping to touch 114.30, which is on the upper band line. Price might begin a downtrend soon but it may touch the upper Bollinger band line before a trace of downtrend. Ichimoku on the daily chart shows no trace of downtrend. We might be expecting 200 pips movement upward.

AUDUSD To Gain More Pips Despite A Long Term Downtrend

It has been a long term downtrend for the $AUDUSD since the beginning of the year. The downtrend is characterized with several lower highs and lower lows. In the last two months, the upward and downward movement of $AUDUSD have been between 300 pips. Price movement tends downwards maintaining the lower part of the Bollinger bands. The USD without argument this year has gained so much against the AUD.

The RSI has not touched the overbought position since January. Since then, price keeps moving downward without ever reaching the overbought or oversold regions. A breakout occurred off the trendlines and price is yet to touch the Bollinger band middle line. It is about 200 pips reaching this point. The future of Ichimoku shows a long downtrend and no trace of a reversal. The last time $AUDUSD maintained a bullish trend was between December 2017 and January 2018. Ever since a reversal occurred, price of $AUDUSD has been on a downtrend.