fbpx

Sony Couldn’t Break Support After Finding New Resistance

This year, $SNE has been in an uptrend. In June, the price of $SNE was clearly moving in the upper region of the Bollinger bands for over 1000 points. In September, it found resistance at 60.99, the all-time high from April 2007. Then the early days of October brought about a sharp downturn of about 800 points.

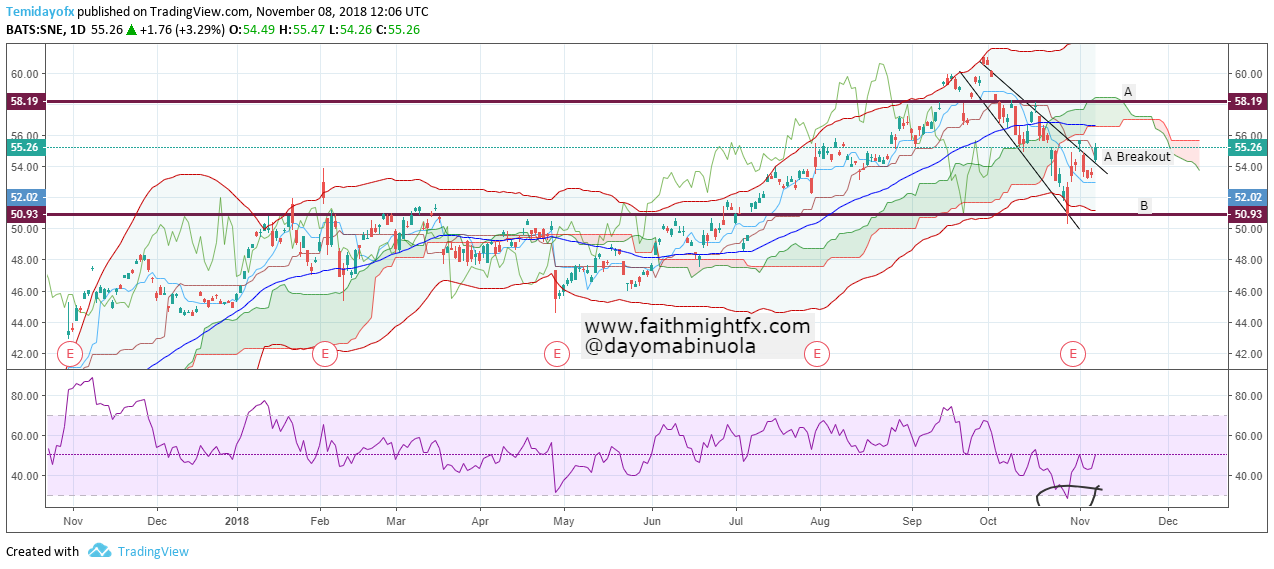
A breakout from the trendlines has occurred, which may signal a bullish movement. Price still maintains the lower part of the band despite the breakout. The Senkou span of the Ichimoku shows a downtrend. RSI indicates an oversold position in the market. Price might reach 58.19 from 55.26 as at the time of this writing. Sony is expected to make a big profit jump due to their winning game strategy. A breakout from the expected 58.19 level could make $SNE resume the upward trend.

Source: Sony Forecasts Big Jump To Record Annual profit On Winning Gaming Strategy-(Reuters.com)

Bank Of America Gaining Strength After A Fall In Market Price

The market value of $BAC worsened in September reaching 25.99 from 30.12. Price rallied majorly between 29.41 and 31.99 throughout this year. $BAC has maintained stability in market price for the most part of 2018. After a fall in price in September, price reached a new low since mid-November 2017. Price movement this year reached 33.05 in March making it the highest price point of $BAC reached since the financial crisis in 2008. Investors might have been undergoing discomfort during the times the market was in a range. In July, price gave a signal of a future downtrend which later occurred in September with over 400 points.


More investors bought shares of $BofA after a new support level was reached in October. Over 100 points was gathered last week when buyers resumed. The RSI on the daily chart shows price has been oversold. If more buyers come on board, price might reach a new resistance at 29.41. Eventually, if price goes up and moves beyond the first resistance level, price might reach 31.00. Though price movement is in the lower region of the band, it could continue higher if price closes above the upper region of the band, it could continue the bullish movement.

JP Morgan Chase Holds Still Support

The price of $JPM found solace around 102.90 level at support and 119.21 level at resistance in 2018. This is a price movement of about 1800 points. That is a whole lot of profits for long term traders. However, the price movement of $JPM in the first half of the year was not good for bulls until July.

$JPM DAILY CHART

A breakout has occurred from the trendlines. This could be an indication for a bullish movement. Price is presently at 109.25 level and might reach 112.75. The RSI never fails in showing us when it is oversold so it may signal another buy in $JPM shares. Price movement to the upper part of the Bollinger bands may show a continuation in upward trend. Ichimoku gives no trace yet for a reversal in price of $JPM. A breakout of price occurred also from the resistance level. Price may move as high as 119.21, which is a major resistance level for this year.