fbpx

MICROSOFT CURRENTLY RANGING AROUND THE ALL-TIME HIGH

In the early trading days in 2018, Microsoft’s share price broke out comfortably above $100. And since then, the price is yet to reverse toward $100. The bull run continued until February 2020 when the price reached $190.82. As at that time, a resistance level was formed around $190.82, which lasted for about 3 months, as the support level was $134.07 in March 2018. This correction was the longest one since 2018, which was about 29.7%. The next rally after the correction has made a price of $MSFT attain $281.11 price.

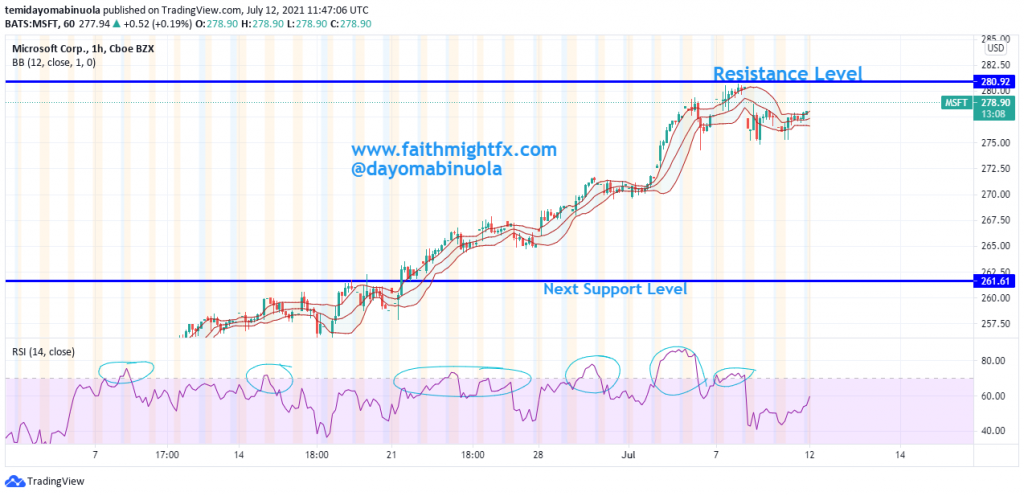
Over the years, $MSFT has been investing hugely in products with Augmented reality and Virtual reality. These investments could be the major reason for the bullish run in the past few years. The most recent all-time high was reached at $281.11, on the 7th of July. The chart has the majority of higher low and higher highs patterns. Since the beginning of June 2020, RSI has shown many levels where price has been overbought.

A reversal could occur as a gap down and a gap up was shown on the chart when the price was below $250. A higher low might begin, which might push the price lower to reach $262.03. Also, many stocks are currently at the all-time high or ranging around the all-time high.

Google Reached An All-Time High

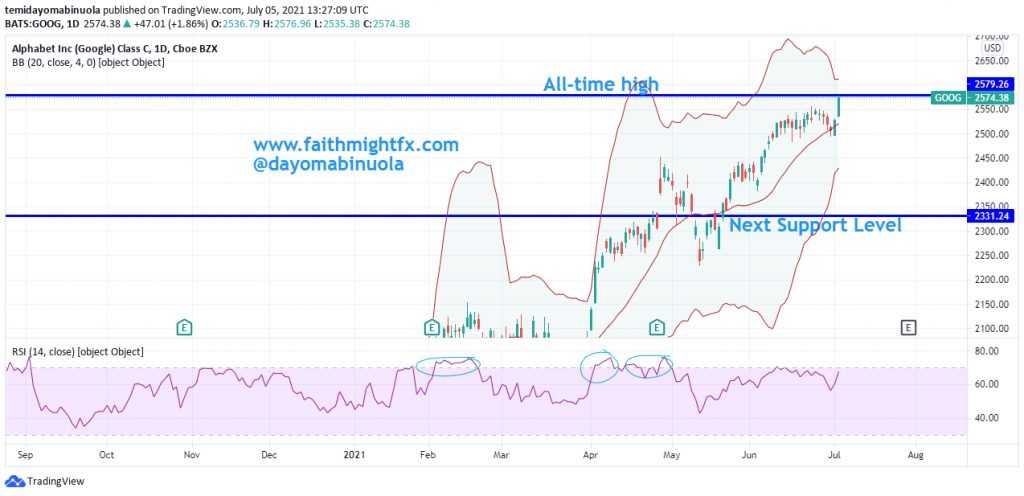
The share price of google at the beginning of 2021 was $1341.91. The bulls have been pushing the price upwards since March 2020, when the price was at $1021. Since the bullish trend started in March 2020, $GOOG has generated over 152%. There have several all-time highs in the last year. This might lead to a price reversal. Google has new products with augmented reality, this could have been the reason for the continuous bullish movement.  Google is currently at an all-time high of $2574.38, the price might reverse with obvious indications on the chart.

The RSI has shown at least three major levels of the price being overbought since the beginning of the year. On the chart, there was a correction that occurred in May 2021, after which the price rallied to a new all-time high at $2574.38. Price tried to touch the middle Bollinger band line before a continued rally, this could be an indication for a possible reversal in price to a new support level at $2331.24. As we await the $GOOG earnings report on the 29th of July, the candlestick for July might be a bearish one with these indications.

MICROSOFT REACHED AN ALL-TIME HIGH, PRICE MIGHT REVERSE.

The monthly chart shows that $MSFT has indeed enjoyed a bull run since 2009. That’s about a 2,000% gain in the last 12years. Despite Bill Gate stepping down from being a member of the board at Microsoft, the share price of $MSFT has continued to increase. In March 2020, the month Bill Gate resigned from being a Board member at Microsoft, the share price of $MSFT closed at $157.60, which means the appreciation was about 72%.

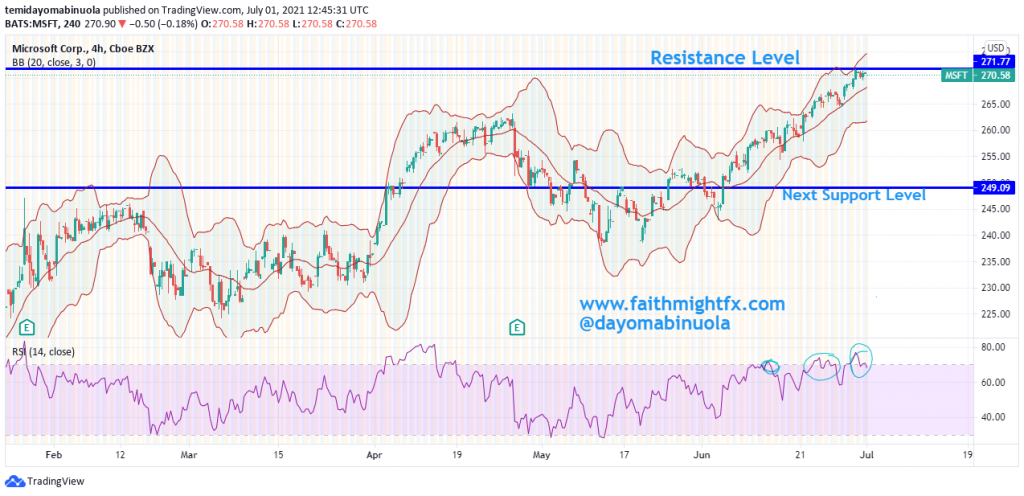
In the past, there have been several all-time highs with minimal reversals. The current share price of $MSFT is at an all-time high at $271.77. There are indications showing that there might be a reversal to the downside, to new support at $249.04. That shows that about 9% might be lost from the current price of $MSFT at $271.77.

RSI has shown 3 obvious levels that price has been overbought. In April, the all-time high was at $263.03, after which a correction occurred which made the price reach $238.11. Price is currently at the upper region of the Bollinger bands. In the month of June, the price touched the middle line of the Bollinger Bands two times.  This might be an indication of a possible reversal.

COINBASE IS CURRENTLY BASING

Coinbase Global ($COIN), which operates, as a cryptocurrency exchange platform, debuted as a public stock in mid-April. At this time, many cryptocurrencies became even more volatile and saw a significant drop in price. Coinbase was founded in June 2012 by Brian Armstrong, a former Airbnb engineer. Armstrong enrolled in the Y Combinator start-up incubator program and received a $150,000 cash infusion.

Since the Coinbase stock debuted publicly, it has been on a downtrend. The share price opened at $381, the intraday high was at $429.54, and then traded as low as $310. The current chart of $COIN is just a good representation of lower lows and lower highs since it was listed. The support level has been maintained at $216.78 since mid of May 2021. Since this May, the price has been ranging between $216.78 and $247.99.

On the RSI, there have been many instances of the price being oversold. Price is currently on the lower region of the Bollinger bands. A breakout to the upside at the breakout level line on the chart might push the price to $300. The crackdown on Crypto in China might have caused the price of $COIN to drop.

However, cryptocurrency has been believed by a few people as the currency of the future.

ETSY SHARE PRICE IN A RANGE

ETSY made its stock market debut on April 16, 2015, with an initial public offering of $16 per share. Etsy was able to sell 13.3 million shares at the time. Since the launch, ETSY has appreciated in value by about 15X.  Put into real perspective, If $1million was invested in $ESTY in 2015, the current value should be over $14million.

ESTY has maintained a bullish run in the past 6years, reaching an all-time high at $252.53.  However, Since the all-time was attained, the price has started to dip. A head and shoulder pattern has been formed between February and April of this year, which brought about a range between $190 and $252.

After the head and shoulder pattern has been formed, there came a dip which made the price reach $153. Since the price fell from an all-time high at $252, $ETSY has lost 39% of its share price. Since the beginning of May 2021, $ETSY price has been between $153.80 and $176.50. Indications show there would be a breakout soon. To the downside or to the upside? There are chances price might appreciate towards $200 in the coming weeks. Business Insider has opined that the next coming month might be bullish for $ETSY( ). Since the recent dip in price, RSI has signaled that the price has been oversold.

JP MORGAN CHASE MIGHT REACH A NEW ALL TIME HIGH

The lowest price of JPM in the last one decade was at $27.71.  In contrast, the current all-time high of JP Morgan chase was reached on the 18th of May 2021 at $165.43. JPM has done about 6X in the last one decade and still looks promising.

Recall, there was a sharp drop in price from $140.48 to $76.52 in 2020. After the correction, a strong support was formed around the price level at $76.52 in March 2020. Since then, monthly candlestick has continued to indicate the full strength of the bulls. In This year alone, $JPM has done over 26.3%.

A gap down occurred in the price of $JPM on the same day of the all-time high. The gap down might be closed with a bullish movement. RSI in the last two months has shown that price has been overbought.

Could this be an indication for a reversal in the price of $JPM? There has been a bullish squeeze since the gap down and a new resistance formed at $164.65. A continuous bullish movement might push price above the resistance level. A breakout of the resistance level might push price to a new all-time high above $165.43.

Dow Jones Might Plunge Further

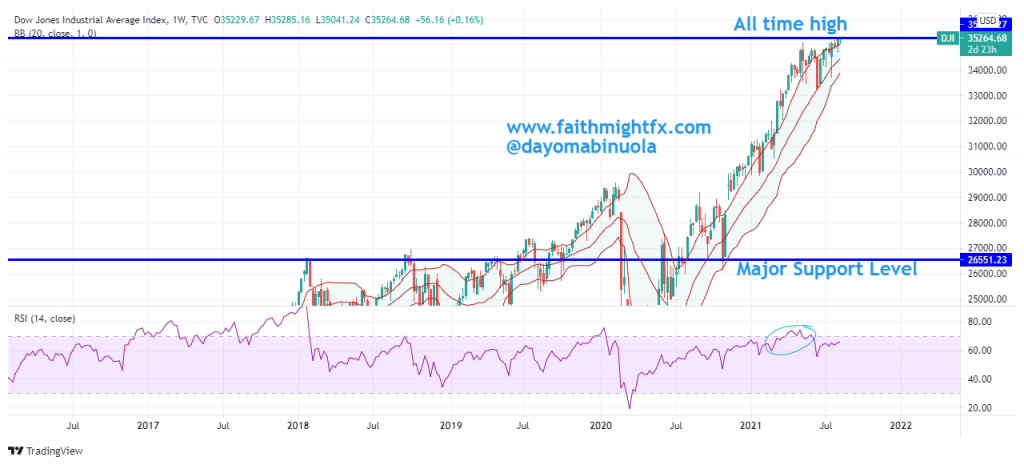
After a major dip to $18,900 occurred in the price of Dow Jones in March 2020. Price retraced to the resistance level at $29,500 in the same month. $DJI broke the resistance level at $29,500 in November 2020. Since this breakout occurred, $DJI has consistently reached a new all-time high every month. The recent all time high occurred this week at $35,100. $DJI’s price at the beginning of this year was at $30,200.  As at today, price of $DJI is at $34,000, which is about 11% gain in 2021.   

After the all-time high at $35,100 was reached this week, two bearish candlesticks were formed in the next days. These two candlesticks were as a result of the inflation data that was released on Wednesday. the $DJI plunged 680 points. Investors might have been fearful, hence the reason for the selling. Both S&P 500 and NASDAQ also took a nosedive. Could this be sign of the beginning of a bearish trend?

When a major dip occurred in March 2020, RSI showed price has been overbought. RSI is currently showing that p rice has been overbought. This could lead to a major dip in price. If this dip occurs, it might make price reach the support level at $26,550. If In the next few weeks, price might just be consolidating around $34,000. If the inflation situation worsens, price might plunge further.

Amazon Might Reach A New All Time High

Amazon share price fell badly towards the end of last year from 1965.54 to 1676.34. This fall might be as a result of the release of third-quarter earnings. Despite concerns about its forward guidance, price of $AMZN is beginning to rise which might make price reach the previous all time high of 2050.30. Throughout the month of May, the $AMZN price was in the lower region of the Bollinger bands. A breakout upwards occurred mid June and price has since then resumed to the upper region of the Bollinger bands. The trendlines have been broken after the dip.

As price rallies, Ichimoku has been able to show us a bullish future and a breakout upwards of the cloud has occurred. This indicates a significant bullish takeover. In April, RSI was able to show an overbought region before the dip. Now the oversold region has been shown on the RSI daily chart which signalled a rally. The efforts of the bulls might make price reach a new high in 2019

Microsoft Share Price Reaches New Resistance Level

Microsoft share price was able to attain an all time high in April 2019. The rise made $MSFT price reach a new resistance level at 130.24. The previous all time high was in October 2018 at a resistance level of 115.63. The price of $MFST has refused to cross over to the lower region of the Bollinger bands for over a decade. With the recent highs reached, price might cross to the lower region of the bands depending on the activities of the sellers.

MSFT Weekly Chart

The trendlines have been broken this week. This might be a likely change of trend where the bulls might reduce activities for the bears to take over. The future of Ichimoku has refused to show a downtrend despite a break down from the trendlines occurring now. $MSFT investors over the years have reaped a bountiful harvest in their investments. At several instances, the RSI has shown price of $MSFT to be overbought. The downward breakout might make price of $MSFT to reach 101.58 as the current market price stands at 124.76.

S&P 500 Might Continue The Dip

Some of the American stocks that had a strong bullish takeover are beginning to reverse in direction. This reversal might affect the $SPX. The $SPX price reached 2945 being our last analysis on $SPX in March shows it will reach 2946(https://faithmightfx.com/2019/03/13/sp-500-approaching-resistance/). That analysis was almost accurate. 2945 being the new resistance level of $SPX became the recent all time high price.

SPX Weekly Chart

A breakdown has occurred from the trendlines which shows a reversal has started. Price of $SPX is currently at 2765.5. The candlesticks have crossed to the lower region of the Bollinger band indicating the strength of the bears in the market. Ichimoku is yet to show a reversal of the uptrend. This time when price reached an all time high, RSI did not show us overbought positions. Also, the penultimate time $SPX reached an all time high in 2018, RSI never showed us overbought positions before a reversal. Though, this week, $SPX has shown the bulls might be trying to takeover. This might be a deceptive bullish move. Price might reach 2547 depending on the activities of the bears.