fbpx

The Jumia IPO is Here

Jumia IPO’d on Friday, April 12th on the New York Stock Exchange. When news of its IPO first hit the wires, it was hailed as Africa’s first tech IPO. I will admit that I immediately bought into the narrative.

After all, I knew that it was (at one point) run by 2 Nigerian founders, Tunde Kehinde and Raphael Afaedor, and that, of course, it serves entirely African markets. Sounds like an African company to me! And if an African tech startup can exhibit a viable exit for investors, this $JMIA story could only help funnel more interest and capital to the entire African ecosystem. That is why the story really excited me.

Skip to the last video??

But by their own admission, $JMIA is not an African company after all. They are not headquartered in Africa, but in Europe. The company was not founded by Kehinde and Afaedor. Rather, those guys were hired to run Rocket Internet’s new e-commerce business it created and named Jumia. Given this (new to me) information, Jumia is very clearly not an African company. And that is OK! I’m not sure why the current executives feel the need to co-opt a brand identity that is not theirs. (And before you go there, Rocket Internet is also a European company.)

Unfortunately, I believe this narrative actually hurts the African ecosystem more than it helps. Because venture capital is such a pattern seeking (copy cat) business model, non-white, non-male founders have historically had much difficulty securing much needed funding to expand their businesses. My initial thoughts were that an actual exit evidenced by this $JMIA IPO will help convince investors that startups on the continent are viable investments. However, $JMIA merely reinforces the stereotypes that white male executives of a company domiciled in the West are the business models worthy of investment. This couldn’t be further from the truth. 

I have been investing in African startups since 2012. And I am currently in stealth mode to expand this work on a larger scale. Stay away from African as an investment ecosystem if you want to. It only leaves more for me and mine. My friend and founder, Teddy Ruge, who of course opened my eyes to the real narrative around $JMIA sums it up best:

We keep building ??

Sources:

Jumia F-1 Statement (SEC)
Jumia investors may regret chasing an elusive dream (The Africa Report)

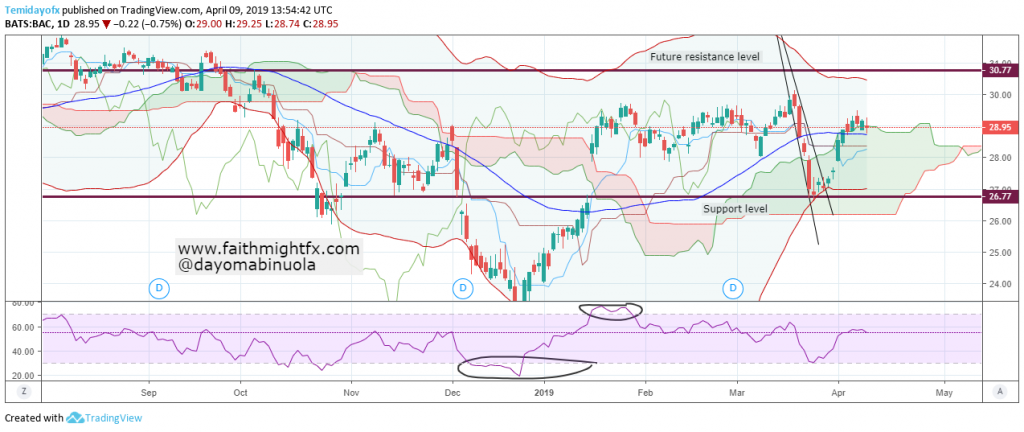
Bank Of America Failed To Break The Support Level

In December last year, Bank Of America share price was as low as 22.73. As the American market went down towards the end of 2018, $BAC also joined in the dip. After this dip, price rallied to the 26.77 level, which initiated to a strong support. There was a gap up on the 16th of January which made price to reach 29.64. After this gap up, a correction has occurred but the price of $BAC was not able to break the support level at 26.77.

Bank OF America Daily Chart


The correction after the gap up made price to cross to the lower region of the Bollinger bands. The trendlines have been broken and indications show a bullish takeover begins. Though we expect the $BAC bulls in the market, Ichimoku has not shown a bullish signal but showed a bearish signal instead. On the daily chart, price of $BAC is overbought. Price being overbought might be deceptive for the bears to get into the market. Currently, price of $BAC has been able to cross to the upper region of the bands. So price of $BAC could reach the next resistance level at 30.77 from its current 28.95.

Boeing Has Lost Its Bullish Strength

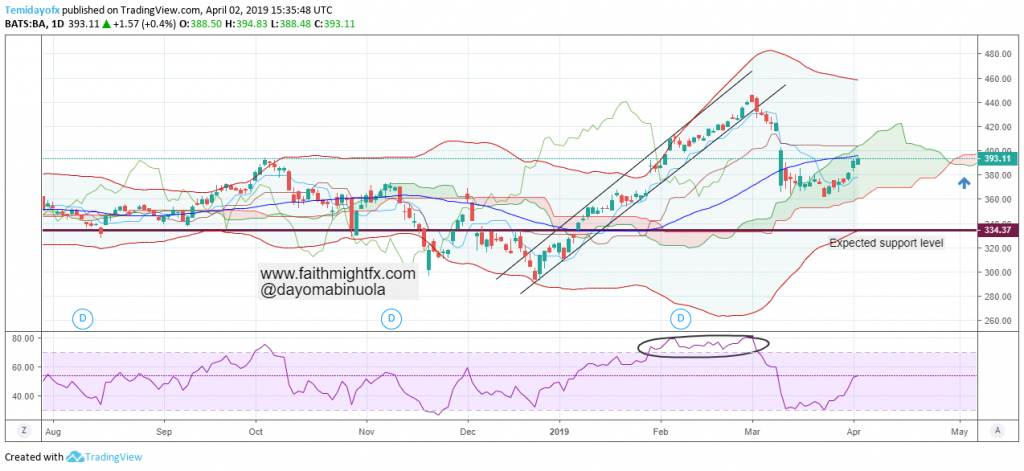
The share of price of Boeing fell after two Boeing planes crashed in the past few months. In 2019, Boeing has been bullish from 315.80 and reached an all time high this year at 447.12. A gap up that occurred in the last few days of January has been filled in March. The price of $BA has been on the upper region of the Bollinger bands throughout the year until mid-month of March. The volatility of $BA in 2018 was quite low until this year.

Throughout February, the price of $BA was overbought on the RSI. The future of Ichimoku has already shown a trace of downtrend. With the analysis using the trendlines, price of $BA could begin to fall from its current 393.26 to 333.71. The price of $BA has crossed to the lower region of the bands. If price of $BA breaks to the downside to reach the expected support level of 333.71, a breakout of the support level could make the price of $BA to continue to move downward.

Mastercard Is Currently Overbought

Mastercard is currently overbought after reaching an all time high for the stock. The new resistance level is at 235.66. The year 2019 has started on a bullish trend from 185.42 to the resistance level of 235.66. The overbought position for $MA was reached first at the beginning of February 2019. Since this time, price has continued to rally in the overbought region which could lead to a reversal on the daily chart.

Ichimoku is currently showing the bulls are in charge of the $MA market. RSI also shows price has been overbought for over a month. As we expect a bearish trend, price of $MA might go below 200. Price is yet to cross to the lower side of the Bollinger bands. A breakout has occurred from the trendlines but price is still in a range. Before the end of April, the bearish trend might become more dominant.

EBAY Share Price In Range, Might Go Bearish


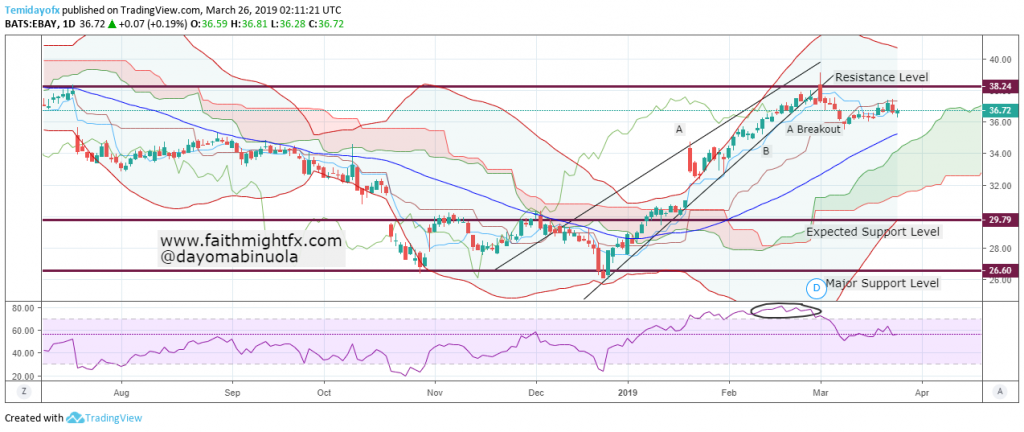
Price of $EBAY has reached the overbought position since January and it is yet to reverse. There was a gap up in January, in which the price is yet to fill up or retrace. $EBAY reached the resistance level at 38.43 on the first trading day of March. Since, $EBAY has been overbought for 2months.

A fall in the price of $EBAY is expected because of the continuous movement of price in the overbought region. As more bears could enter the market, the share of $EBAY might reach 29.79 from 36.72, which could serve as the new support level. The Ichimoku still shows the bulls are aggressively in power but the bears, in the long run, could overpower the efforts of the bulls. RSI undoubtedly is overbought after which a breakdown from the trendlines has occurred. As we await the bearish movement to gain momentum, the bulls might decide to enter the market after finding support at 29.79.

Hewlett Packard Price in Range, Might Go Bullish


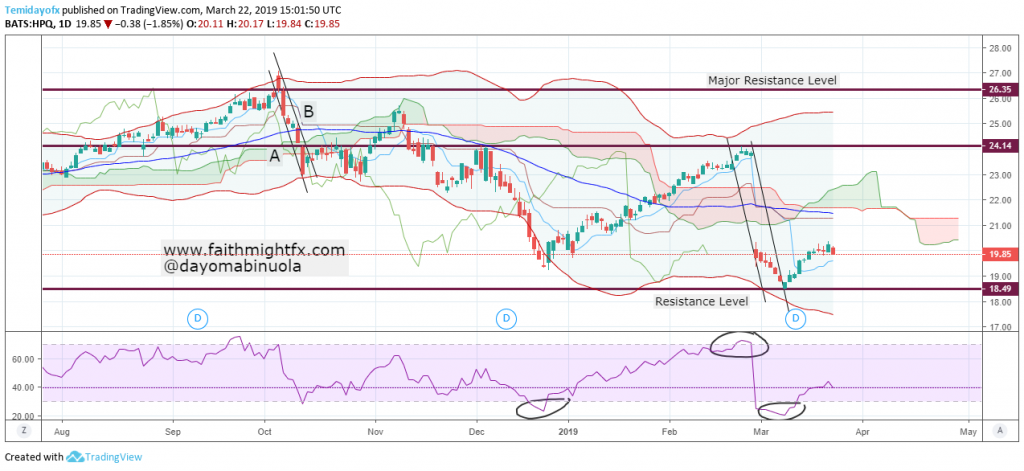
The year 2019 started on a good note for the $HPQ bulls when price moved from 20.20 on the first trading day to 24.14 on the 26th of February. Ever since the recent high was reached at 27.70 in 2018, price has ceased to reach that level again. Nevertheless, the price of $HPQ continues to maintain the support level at 19.45. On the 27th day of February, there was a gap down to 18.49 from the resistance level.

RSI shows that before the gap down, price of $HPQ had been overbought. The gap down made the RSI to reach the oversold region and since then, price remains in the lower region of the Bollinger bands. Ichimoku’s future still shows a bearish trend still active.

Facebook Share Price To Fall

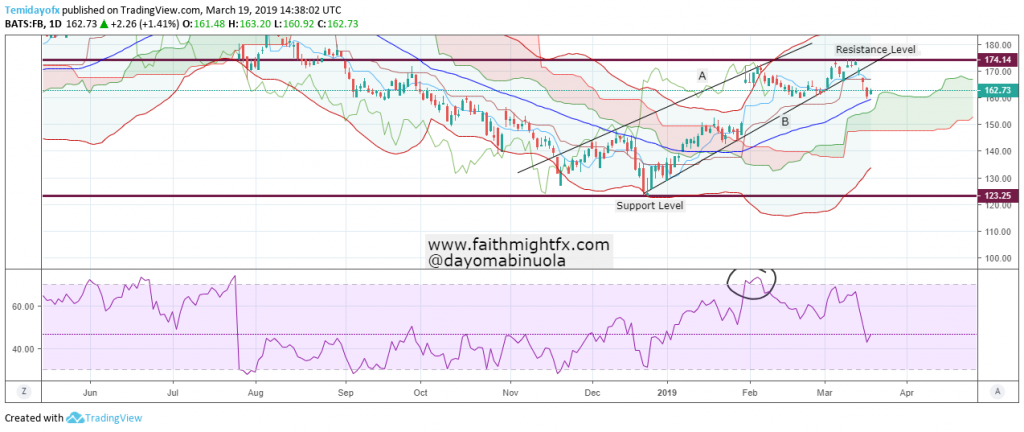
On the 25th of January, we released an article stating Facebook bears are getting out of the market. At this point, our expectation for $FB share price to reach 160 has been met, which could pave way for the bears to resume trading. A breakdown from the trendlines A and B occurred in the last two trading days of last week. A double bounce in price touched the resistance level at 174.14 in the last 2 months, technically indicating a possibility for a reversal.

On the 31st of January, there was a jump in the price of $FB from 150.61 to 165.36. Ever since the jump occurred, a range in price resumed. Price of $FB is beginning to touch the middle Bollinger band line, which might likely indicate a weak bullish trend. Though the future of Ichimoku shows no reversal, price of $FB might begin to fall. A fall in price might make the $FB shares to drop to 139.06. Taking a further look at the RSI, price of $FB has been overbought, preparing for a reversal.

Walmart Bulls Might Begin To Relent


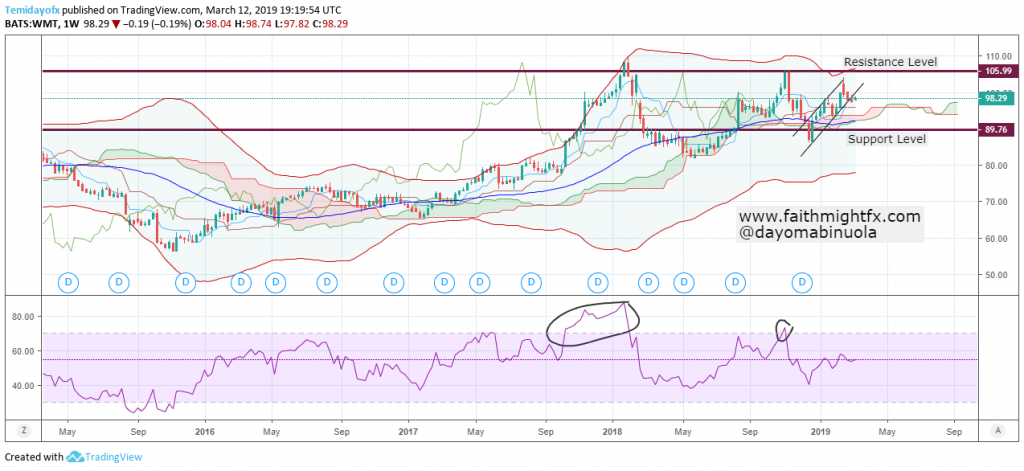
Ever since Walmart hit an all time high in January 2018, the bullish strength began to depreciate. Though a correction occurred, price only reached the resistance level 105.99. Since then, the Ichimoku has been having a rough shape which gives a dicey signal for the $WMT market. As price of $WMT is currently at 98.32, price might go lower. It is obvious there is a tussle between the $WMT bears and bulls since the all time high was reached.

Indications with the RSI have shown 2 overbought positions in 2018. Price is yet to retrace fully and still maintains the upper region of the Bollinger bands. At two different instances, price crossed to the lower region of the bands but crossed back to the upper region. A breakdown from the support level 89.76 might make price to continue the downtrend to reach 77.92 in the coming weeks.

S&P 500 Approaching Resistance

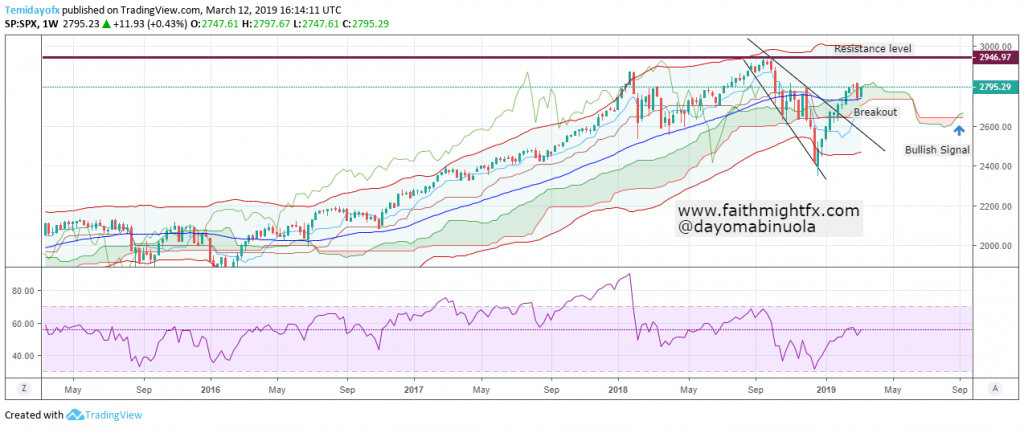
In the first week of October 2018, S&P 500 reached an all time high of 2946.97 before a reversal began. Before then, there was an indication of an oversold region in January 2018 on the weekly chart and price of $SPX moved downwards with 500points. Also, before the end of 2018, price was beginning to gain momentum through the active roles of the bulls.

Despite the selloff on the weekly chart, $SPX never showed an oversold position on the RSI before price rallied. A breakout from the trendlines which has occurred might be a strong signal for a bullish continuation move towards the resistance level. The future of Ichimoku has already given us a signal for a complete bullish takeover. In the second trading week of February, price of $SPX moved to the upper region of the Bollinger bands and it is yet to reverse. $SPX bulls might push price to 2946.97, the all time high.

The IBM Might Lose Its Uptrend Grip

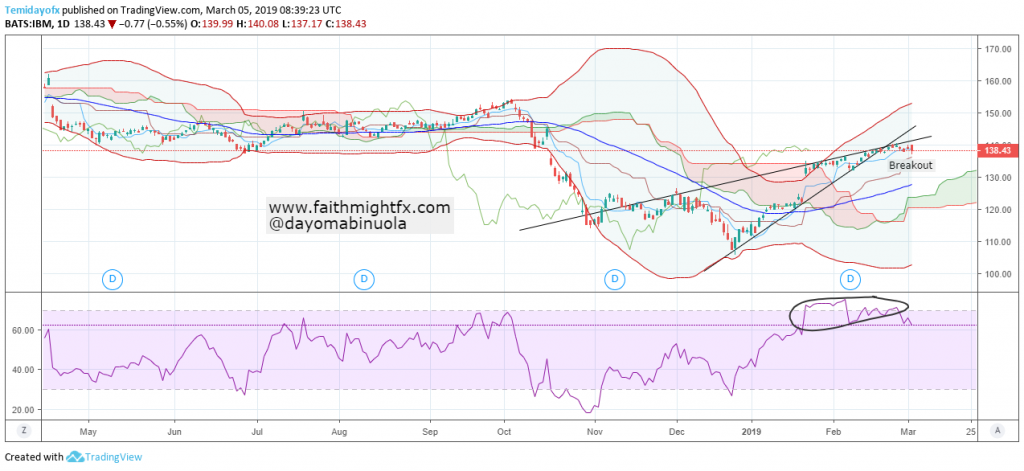
For over 6 months in 2018, the $IBM price pattern showed little volatility until the first week in October when the price fell from 154.48 to 114.26. After this fall tried to maintain support at that same level, a continued move lower started in December to the next support level at 107.66. The second support level at 107.66 serves as a stronger support because a bounce occurred. Since that time, $IBM share price has maintained an uptrend in 2019, with over 2000points before reaching an overbought position.


Price being undoubtedly overbought in the past few days is a likely signal for a reversal downwards. The trendlines have been broken downward and the bulls seem to be taking a break from the market. Despite the RSI showing an overbought region, the Ichimoku’s future shows strong bullish action still intact. On the 23rd of January, there was a gap upward which is yet to be filled. Though $IBM still maintains the upper region of the Bollinger bands, the bull power might begin to lose its momentum.