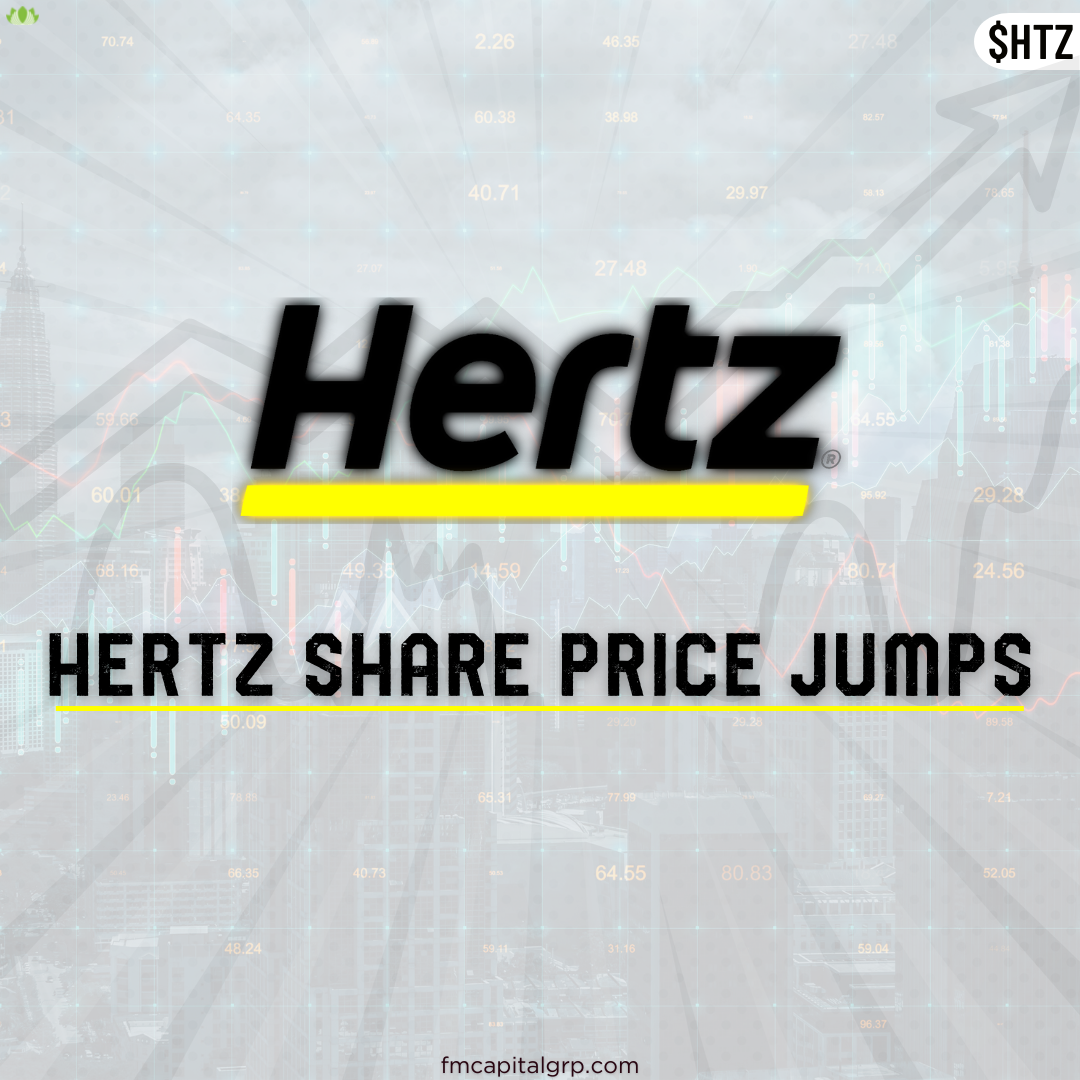
fbpx

Snapchat Loses 39% Of Share Value In 24 hours

Snapchat had its IPO in March 2017 at $24. The first two trading days closed with the bulls in charge. The third trading day had the bears gaining traction and this traction transitioned into a full-blown bearish run up until December 2018. In that month of December 2018, Snapchat share price hit $4.88, which stands as the all-time low.

Monthly Chart

2019 began on a brighter note in comparison to the previous year as the first seven months of 2019 closed bullish. This bull trend couldn’t complete a year-long run as price ranged between $12 and $18. A few months into 2020, precisely in April, the bulls became active while price was about $11. On the monthly chart, a bullish steam picked up and it raved on until Snapchat’s share price hit $83, which stands as the all-time high. This all-time high was reached in September 2021.

Weekly Chart

Ever since this all-time high was hit, Snapchat’s share price has been falling heavily. Since September 2021 till date, all monthly candlesticks have closed bearish except for February 2022. So far, Snapchat has lost over 87% of its all-time high. Since May 24 2022, the price of Snapchat has been ranging between $11 and $15. 

On the 22nd of July, 2022, a gap down occurred that resulted in a 39% loss in value as price fell from $16 to $9.97. The last time price got to this level was in March 2020 during the lockdown. In the next few weeks, we could see price rallying above $20 as price is currently oversold on the RSI.

Some of these ideas are in our clients’ portfolios. To understand if this one can work for you or for help to invest your own wealth, talk to our advisors at FM Capital Group. Would you like more information on how to get stocks in your portfolio? Schedule a meeting with us here

ETSY Loses More Than 8% In One Day

Since the all-time high of Etsy was reached in November 2021 at $309.06, price has continued to dwindle as it has lost over 75% of its all-time high. The price of Etsy at the beginning of 2022 was at $222. Etsy has not recorded any profits this year as price has kept falling from the opening price of the year.

Daily Chart

Etsy’s share price is currently at $74.04 and the current support level sits at $66.98. Earlier in the year, precisely between February and April, there was a range in price between $113 and $164. The price broke out late in April which led the price to reach its current support level in mid-June 2022. This support level was last reached in May 2020.

Weekly Chart

On the daily, weekly, and monthly charts, there are no indicators of price being oversold on the RSI. Could this be an indication of a possible continued downward run of Etsy’s share price keeping in mind that on the 28th of June, 2022, the price opened at $79.11 and closed at $74.04 which was an 8% loss in just a single day? On another hand, candlesticks on the daily time frame indicate that price has been consolidating. From our analysis, we see the bears continuing to push the price lower despite the consolidation.

Some of these ideas are in our clients’ portfolios. To understand if this one can work for you or for help to invest your own wealth, talk to our advisors at FM Capital Group. Would you like more information on how to get stocks in your portfolio? Schedule a meeting with us here

Disney Share Price Heads Back To Lockdown’s Low

Like many other stocks, Disney share price fell to $78.63 in March 2020 as a result of the global lockdown. Prior to the fall in 2020, Disney’s all-time high was at $154.84. The ease of lockdown led to the rally that pushed the price of Disney all the way up to $203.12 in March 2021. This price currently stands as the all-time high.

Weekly chart

After the all-time high, the share price was caught in a range on the weekly chart. The range began at the end of March 2021 and stretched to the first week of November 2021. The share price broke out of the range to the downside in the second week of November 2021. The breakout has led to a continuous downward slope in price as price as of June 23, 2022 is at $94.30, which is over a 50% loss from the all-time high.

Daily Chart

We can say Disney’s share price is currently in the region it was during the lockdown. Recent reports claim Disney’s share price dip is partly due to their insistence in inserting Queer ideology into its children movies which people see as “child-grooming” and therefore, reprehensible. Indications on RSI shows that price is currently oversold on the weekly time frame. Our analysts see Disney’s share price fall below the Lockdown low of $78.63.

Some of these ideas are in our clients’ portfolios. To understand if this one can work for you or for help to invest your own wealth, talk to our advisors at FM Capital Group. Would you like more information on how to get stocks in your portfolio? Schedule a meeting with us here

Walmart Share Price Falls to A Two-Year Low

The American multinational retail company reached an all-time high at $161.03 in April 2022. This point was reached after price ranged from the latter part of 2021 to March 2022. Following the range, price broke out and headed for the aforementioned point that became the all-time high. 

Weekly Chart

The month of May 2022 ended bearish after the price opened at $154.82 and closed at $128.38. The month of June 2022 has begun on a bearish note but $5 has been lost from the opening price of the month of June 2022 which was at $154.82. In May 2022, the price fell to as low as $117.05. Price last hit this point in July 2020.

Monthly Chart

RSI showed in Q4 2020 that price has been overbought. The trendline is yet to be broken despite the corrections. The 4-Hr Chart shows there was a gap down in the price of Walmart mid-May 2022. This gap down might close up and it could be an opportunity for the Walmart bulls to push price higher from the current price of $123.30. We might see price reach a new all-time high in the coming weeks.

Some of these ideas are in our clients’ portfolios. To understand if this one can work for you or for help to invest your own wealth, talk to our advisors at FM Capital Group. Would you like more information on how to get stocks in your portfolio? Schedule a meeting with us here

Kidney Dialysis Firm, Davita, Loses 2022 Gains

Davita is a US healthcare service provider with a focus on kidney dialysis services. Davita has over 2800 outpatient dialysis centers in the United States which serves over 200,000 patients. They also have 321 outpatient dialysis centers in 10 other countries serving 3200 patients.

Monthly Chart

Davita was founded in 1979 and it got listed on the New York Stock Exchange in 1995 at $3.50 IPO price. Price rallied for a few years after the IPO but in the year 2000, price fell to $0.72 per share which is Davita’s worst share price ever since it launched on the NYSE. Since then, Davita’s share price has rallied to an all-time high at $136.62 in August 2021. This is over 100X of the lowest ever price. 

When price reached an all-time high, RSI also showed that price had been overbought on the monthly time frame. Price fell shortly afterwards to $94.34 in November 2021. The opening price of Davita at the start of the year 2022 was $114.10. Price rallied to the current year’s high at $124.85. However, the bears are back in action as Davita’s share price closed below $100 at the end of May.

Daily Chart

As price consolidates in the next few weeks, we might be seeing a price rally above $100. Our analysts are seeing the price of Davita rise to $120 in the coming months. The recent news of Davita’s partnership with Medtronic to form a new kidney tech company worth about $200million could also trigger a rally from a fundamental analysis standpoint. We’ll see!

Some of these ideas are in our clients’ portfolios. To understand if this one can work for you or for help to invest your own wealth, talk to our advisors at FM Capital Group. Would you like more information on how to get stocks in your portfolio? Schedule a meeting with us here

Is Halliburton’s Share Price Heading For A Fall?

Just like many stock prices in Q1 2020, the share price of Halliburton fell from $24.32 at the beginning of the year to $4.33 in the same quarter which was about an 83% loss in its value. This could have been due to the global lockdown from the Covid-19 pandemic.

Monthly Chart

In hindsight, the all-time high of Halliburton was reached in July 2014 at $74.21. Ever since the price hit that peak on the monthly chart, it has been unable to break that price to the upside. Each time the bulls trigger a rally, the bears respond aggressively and the price is pushed lower. Since the all-time high in 2014, the lowest price Halliburton has hit was the aforementioned $4.33 in Q1 2020.

4hr Chart

Halliburton recovered fairly quickly from the Covid hit and began a bull run at the beginning of April 2020. This rally lasted for two years hitting a high of $42.54 in April 2022. In other words, from the lockdown low to this current high, Halliburton has experienced at least 9X in return. The last time Halliburton’s share price hit the current high of $42.54 was in October 2018.

After the high of $42.54 in April 2022, the price fell to reach $33.30 in May 2022. A bounce occurred afterward as the price was able to rally to $42.12 which was on May 31, 2022. There are indications that the bears might push the price lower to $34.

Some of these ideas are in our clients’ portfolios. To understand if this one can work for you or for help to invest your own wealth, talk to our advisors at FM Capital Group. Would you like more information on how to get stocks in your portfolio? Schedule a meeting with us here

Sunrun Rallies After Hitting Lowest Point Of The Year

Sunrun is an American provider of residential solar panels and home batteries out of San Francisco, California. It was founded in 2007. The firm was able to raise $12million in venture capital funding in June 2008. In 2009, Sunrun closed a Series B funding of $18million. They have had other sources of funds after the Series B.

In 2015, Sunrun went public on NASDAQ at $14 per share with an initial market cap of $1.36billion. Sunrun’s annual revenue as of 2020 was $92million. The lowest point Sunrun’s share price was in the year 2020 was at $7.83. This happened in March 2020. The price dropped to this lowest point from $23.58, where it was just a month before that i.e. February 2020. This was about a 67% loss in its value.

Weekly Chart

Price jumped dramatically from the then-lowest price of $7.83 in March 2020 to the 2020 high of $82.67 in September 2020. This is about 11X of the lowest price in just 6 months. After this extraordinary rally, the price closed at the end of 2020 at $69.39. There was a temporary rally in 2021 as the price of Sunrun in January 2021 hit $100 for the first time in its history-making it an all-time high. 

Daily Chart

Ever since this threshold was reached, Sunrun has been on a losing streak. The lowest price of Sunrun this year was reached in the second week of May 2022 at $16.82. Price, however, has been consolidating since mid-April on the weekly chart, and it rallied up from the lowest price to $26 where it currently is. We might be seeing the rally continuing and the price reaching $40 and even more in the coming months.

Some of these ideas are in our clients’ portfolios. To understand if this one can work for you or for help to invest your own wealth, talk to our advisors at FM Capital Group. Would you like more information on how to get stocks in your portfolio? Schedule a meeting with us here

Coca-Cola Share Price Jumps

After the full takeover of BodyArmor by Coca-Cola in November 2021, the share price of Coca-Cola had a brief bullish run that took the share price from $56.29 in November 2021 to $67.11 in April 2022, which now stands as the current all-time high for Coca-Cola. 

Daily Chart

In the month of May 2022, Coca-Cola’s share price dipped from the all-time high down to $62.66. Price rallied shortly afterward and the price reached $66.39. The bears counteracted the rally as the price was pushed down to $59.66. $59.66 is the current support level. In the week of May 23rd, the price rallied and the bulls were able to get the price to $64.68 which was the closing price for the week.

Weekly Chart

This recent bull run might not be maintained as the bears might overpower the bulls and push price lower to reach $60. If the price eventually breaks $60 to the downside, the price might continue to fall further.

Some of these ideas are in our clients’ portfolios. To understand if this one can work for you or for help to invest your own wealth, talk to our advisors at FM Capital Group. Would you like more information on how to get stocks in your portfolio? Schedule a meeting with us here

Tesla Share Price Continues To Fall

Since April 2020, the charts on Tesla have been bullish. This upward trend occurred in spite of the pandemic that crashed many stocks. The price at the beginning of the bull run in April 2020 was $100 per share after the stock split. (Please note that all prices are quoted since the stock split in August 2020). This continued until the end of the year despite little corrections in between. The $TSLA price soared on this bullish energy to an all-time high of $1,245 in November 2021.

Daily Chart

There has been a huge correction since the all-time high in November 2021 as price has been falling. This bearish run saw a little bullish movement which occurred in March 2022 with the price experiencing a temporary rally. The bulls, however, were counteracted by the bears and the price continued its downward trend.  In Q4 2021, our analysts concluded that the share price of Tesla could go below $1000 after reaching a new high at $1092 in October 2021.

Tesla’s price is currently at $709.81 per share. The worst closing price on the monthly chart since May 2021 was $625. This bearish run might push the price down towards $600 per share. RSI has indicated that the price has been overbought on both the weekly and monthly charts since November 2021.

Monthly Chart

Some of these ideas are in our clients’ portfolios. To understand if this one can work for you or for help to invest your own wealth, talk to our advisors at FM Capital Group. Would you like more information on how to get stocks in your portfolio? Schedule a meeting with us here

Coinbase Share Price On A Catastrophic Descent

Coinbase was one of the most promising stocks of 2021 because right on the first day it launched on NASDAQ, its share price shot from $379 to $428 in less than 24 hours. This price rise led many investors to buy into Coinbase as they expected the price to keep up the bullish momentum. However, it seems fortune was not on the side of Coinbase after all. 

Weekly Chart

For the first 6 weeks post-IPO in April 2021, the price began its descent, but investors didn’t worry. The price then began to range from that time until October 2021. At the end of October 2021, the price closed at $318. Afterward, the price began a long-awaited rally that pushed the price to $368. But this price will end up becoming the high in Q4 2021. Since then, Coinbase’s price has been remarkably bearish. Despite being the month of its high, November managed to close on a bearish note. The months that followed – from December 2021 to April 2022 – have all closed with a bearish candlestick.

Daily Chart

As mentioned earlier, Coinbase’s price has been majorly bearish since the end of the IPO day on April 14, 2021. All investors that bought Coinbase post-IPO day are at a loss, and the loss seems to be getting worse by the day as the price plunges to the $100 psychological level. RSI indicates an oversold position on the daily and weekly time frames which could be an indication of a possible rally. Our analysts look forward to the formation of an inverted head and shoulder pattern on the charts. If this happens, bulls can pick up some steam and push the price above $200.

Some of these ideas are in our clients’ portfolios. To understand if this one can work for you or for help to invest your own wealth, talk to our advisors at FM Capital Group. Would you like more information on how to get stocks in your portfolio? Schedule a meeting with us here.