fbpx

The Next Bear Market Could Be In Bonds

There is always a bull market somewhere.

Jim Cramer

When oil markets turned negative in April, gold was making new highs at the time. When stocks crashed 2 months ago, bonds made all time highs. Investors have to start seeing price crashes as a signal of opportunity…opportunity in other markets.

When 30-year U.S. Treasury bonds (expressed in $TLT) made new all-time highs, the Fed had slashed interest rates 150 bps in 3 weeks and put the market on notice with brand new lending facilities and unprecedented QE. Since then, markets have been digesting this newly deployed medicine to the financial tremors of a public health crisis. This digestion hasn’t been pretty for U.S. Treasuries. $TLT corrected lower and then settled into a trading range in the month of May. While price is still in a correction, there are some technical and fundamental alignments that make a bear case for bonds.

TLT WEEKLY CHART

1. The failed high on the corrective bounce with new lows.

A deep correction immediately followed the blowoff rally in April. That correction moved price right into the 61.8% Fibonacci level. So this rally back above the 160.00 level is fairly impressive. It’s been fueled by QE and interest rate cuts along with a commitment to indefinite monetary policy of the most extreme measures from Federal Reserve Chairman Powell just last week. However, all of that has not moved price to new highs. In fact, the failed high signals price moves below that correction low at 139.01. That’s over 20 points lower than today’s 163.59 closing price.

2. The bearish divergence in RSI

The RSI on the weekly chart is showing a divergence with price at the notable all-time high. Subsequent momentum since then has been diminishing and, today, has broken lower to with a close at new lows since the beginning of March. Even as price recovered in March and April, the RSI continued to put in lower highs along with the lower highs in price which is confirming price action. First the divergence bearish signal. Then the weakening strength to confirm that more sellers are entering the market (or perhaps that more buyers are exiting).

3. The geopolitical risk is quietly escalating between the U.S. and China

What would be a real reason for bonds to sell off though? Well what about when the largest holder of long-term bonds decides they rather hold another asset instead? While the war of words may have ceased at the end of last year, China has allowed its currency, which it held in tight control, to devalue this year. In the second half of 2019, the $USDCHY first moved above the coveted 7.00 resistance level for the first time since 2008. When it seemed like the U.S. and China had come to some agreement, the $USDCHY dropped back below 7.00. Since tensions have warmed back up as COVID-19 ravished the United States, the $USDCNY has moved back above the 7.00 resistance level with fresh bullish momentum. It is expected that the Chinese government would be quite comfortable with allowing market forces to take its currency even lower.

All that and the situation in Hong Kong makes things even more worrisome. With mainland China changing the laws last minute this week, watch how markets react to Hong Kong, basically, get taken back over by China. This is a huge deal for financial markets and a big signal from China that don’t feel the need to participate in free markets for its long-term growth plans. So does it really need all those U.S. Treasury bonds now too? Interesting times…

[UPDATE] 4. The Fed

My fellow lady trader, @NicTrades, summed it up best.

We can’t both be wrong. Can we? 😉

Read more:


If you are interested in learning how I found these levels, please check out the CHARTS101 course. Read the charts for yourself so you can trade what you see and not what I think.

My 2019 Outlook

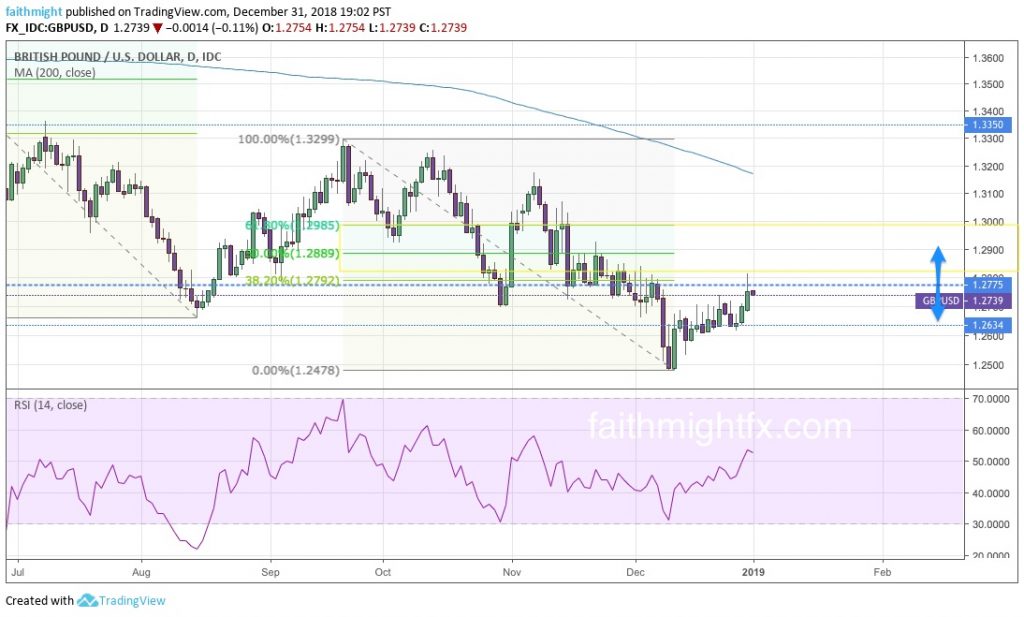
Despite today’s New Year’s Eve rally, sterling has closed 2018 at some of the lowest levels seen since 1985. That’s not insignificant. And given that we still have Brexit drama, the U.S. government shutdown, crashing equity markets and tightening monetary policy even if through unconventional means, 2019 is not shaping up to be a bullish year for sterling.

GBPUSD DAILY CHART

PREDICTION: The $GBPUSD will continue to rally to the 50% Fibonacci retracement level pictured above at 1.2889. Because the markets like to be cruel, I can see it moving even higher to the 61.8% Fibonacci level. At that level, so close to the major psychological level at 1.3000, bears start to turn bullish and major stops get tested. Just when it seems like sterling will really make a bullish reversal, it will plummet to make new lows at 1.2250. Later in the first quarter as the Brexit deadline approaches, the 2016 Brexit referendum lows at 1.1950 (depending on your broker) will be probed. The market’s reaction to the Brexit deal that does finally materialize will determine where we go from there.

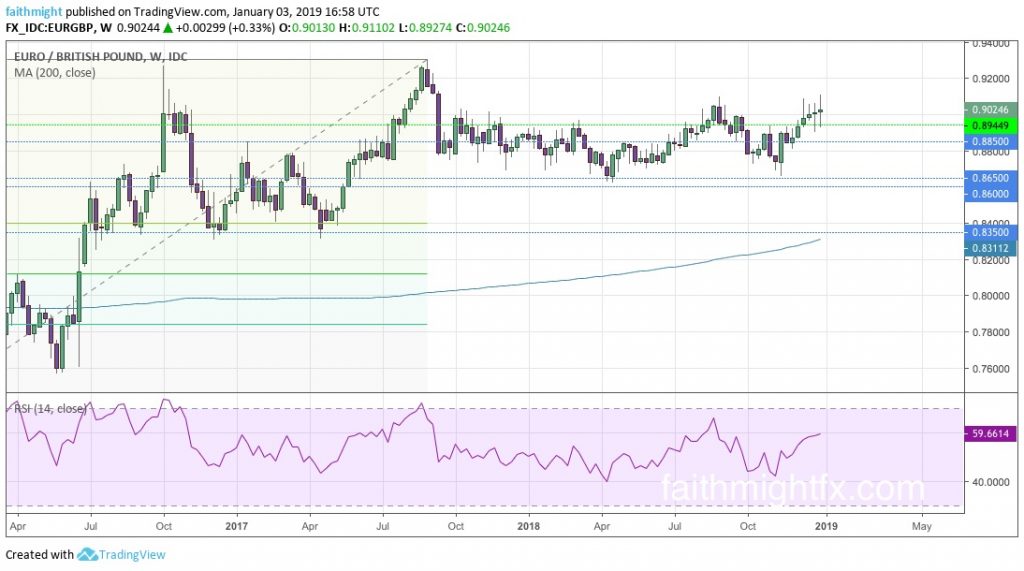
The euro celebrates 20 years this year! And its 20th birthday may be a good year for the euro, particularly against this GBP weakness. But the $EURGBP remains fairly rangebound to start the  new year. In fact, it has been rangebound since late 2017 after reaching new highs at 0.9306. However, it is a bullish range as this sideways action for the past 2 years has never managed to move low enough into the Fibonacci retracement levels on the weekly chart.

EURGBP WEEKLY CHART

PREDICTION: The $EURGBP continues to move higher. But it will be a grind and stair step higher as the markets contend with European politics in France, Italy and Great Britain. When the market finally resolves this 2-year long consolidation period, the $EURGBP will reach and break above the 0.9306 highs set back in 2017.

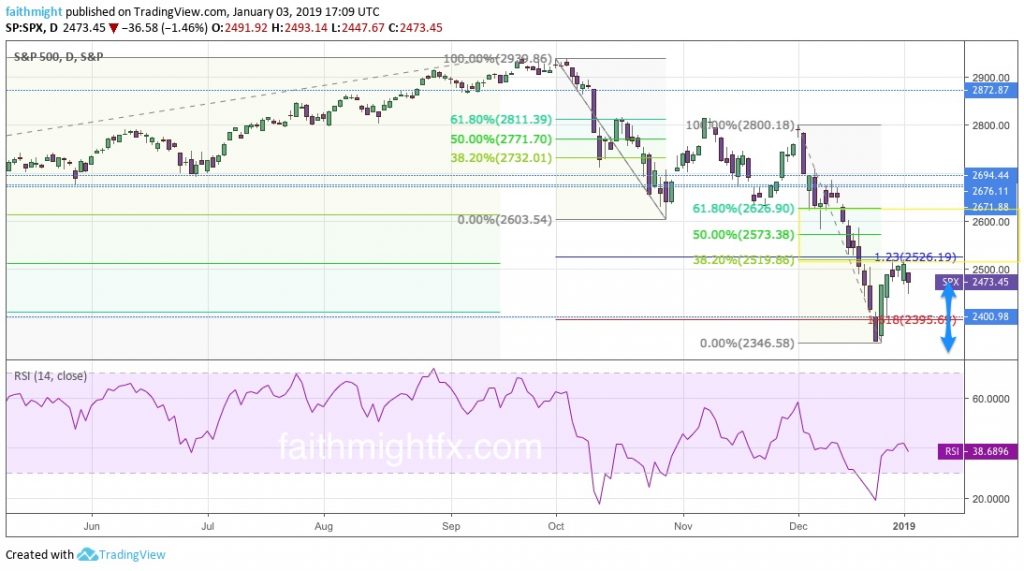
Equities rocked investors in 2018 when it did not deliver the Santa Claus rally that investors have come to rely on for the past 8 years. Instead, we were greeted with the worst Christmas stock market when the S&P closed down 2.71% on Christmas Eve falling to 2346. It was the worst Christmas Eve ever since 1985 when it fell 0.69%.

The 2400 level is a huge level in the S&P 500 ($SPX). This level marks the 2017 highs where price stalled, consolidated for a few months, and then barreled through that resistance to then new all-time highs. Those December lows mark a level of real support that I honestly have had my eye on since 2017. At that time, I expected a correction in price lower. Rather, it was a correction through time as bulls continued to buy the dips. This year, 2019, however, is a very different market.

S&P 500 DAILY CHART

PREDICTION: It seems any corrective bounce higher will remain below the lows at 2600. Above the 2600 level, equities may be ready to start a new bull market. But if it can’t hold above that level, I would look for $SPX to make new lows below the 2400 level. A break below the 2346 low sees price move to the 2132 support level.

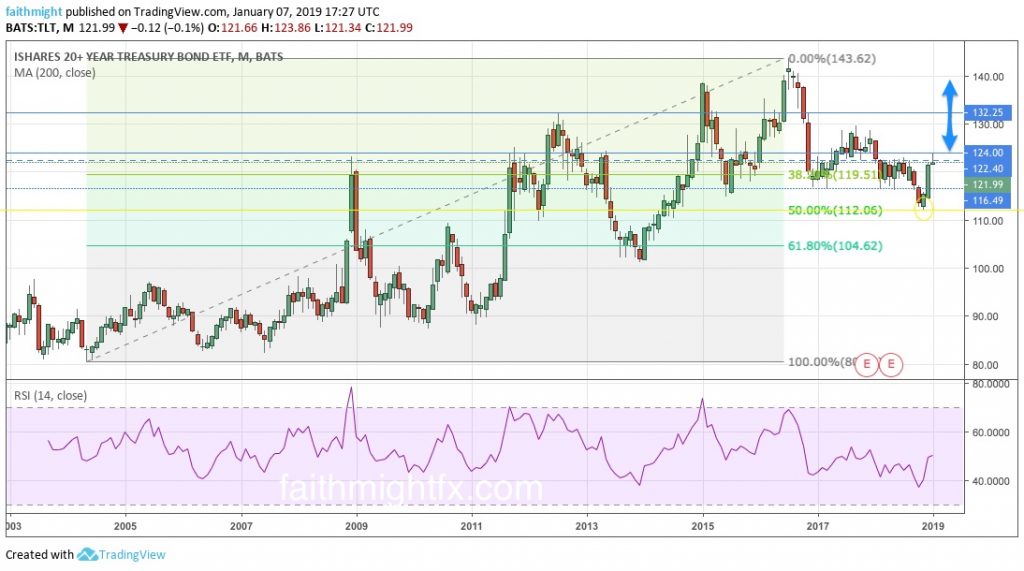
A discussion on stocks is just not complete without a mention of bonds. After peaking in 2016, $TLT plummeted just 2 months later. The $TLT was in a free fall right to the 116 support level where it consolidated before moving lower. Many cried that bonds were in a bear market and they would be right, looking on short to midterm timeframes. But on the monthly chart, $TLT was still in a correction (albeit a very deep correction). As such, the 2018 lows were very important. They marked the 50% Fibonacci retracement level on the monthly chart. It would have sparked mad capitulation had that level been breached.

TLT MONTHLY CHART

PREDICTION: Now that price has moved back above the 116 support-turned-resistance level, $TLT looks well-supported to move much higher from current levels. I like a return to 130 in $TLT. A move above that psychological level clears the way to 132.25 where the market will have to make a decision. Depending on how investors are feeling about risk, price would need to hold above 132.25 for the bull move to continue higher and challenge the all-time highs at 140.13.

2018 was a year full of ups and downs. Nicely, most of those ups happened in my career. The downs last year really did make me stronger and propelled me in new directions that should be very good for the company and my career in 2019. Cheers to the new year! ?

Source: @cubewealth

ON THE AIR with FUTURES with Ben Lichtenstein

Yesterday, June 25th, was my 3rd time on this show. And it was my 1ST time feeling comfortable in front of the camera. A huge THANK YOU to Ben, Alex and the folks at TD Ameritrade Network. They kept asking me back, ha! That was a good sign after my initial appearance (which still makes me cringe lol). Thanks for giving me chance after chance.

My discussion with Ben focused on this week’s fundamental outlook. However, investors should watch these themes, not just for this week, but for this entire summer. Our investors spent the spring getting in position to take advantage of the summer opportunities brought about by active central banks, trade wars and risk aversion. Investors must always stay position to take advantage of developments as they come in markets. I talk to Ben about a few of them. Click the screenshot of my segment below to listen to the show.

CLICK TO WATCH THE FULL SHOW


There are ebbs and flows to every market. Trade what you see. Learn how. Invest with a pro. [sponsored]

What’s The Deal With Bonds

With the stock markets entering 2017 rallying into all-time highs, bonds have gotten very little attention. Or rather, they are just getting very negative attention. I really don’t like all the high-yield U.S. bonds and junk bonds that seems to get most of that attention. I think if you going to buy U.S. bonds, you have to look at Treasuries. For those that don’t know, buying a bond is basically lending money with the expectation that you will receive your money back at the end of some time period and receive interest payments while you wait. With the backing of the U.S. government, which I hope we can still rely on over these next 4 years, bonds have always been thought of as the safest investment an investor can make.

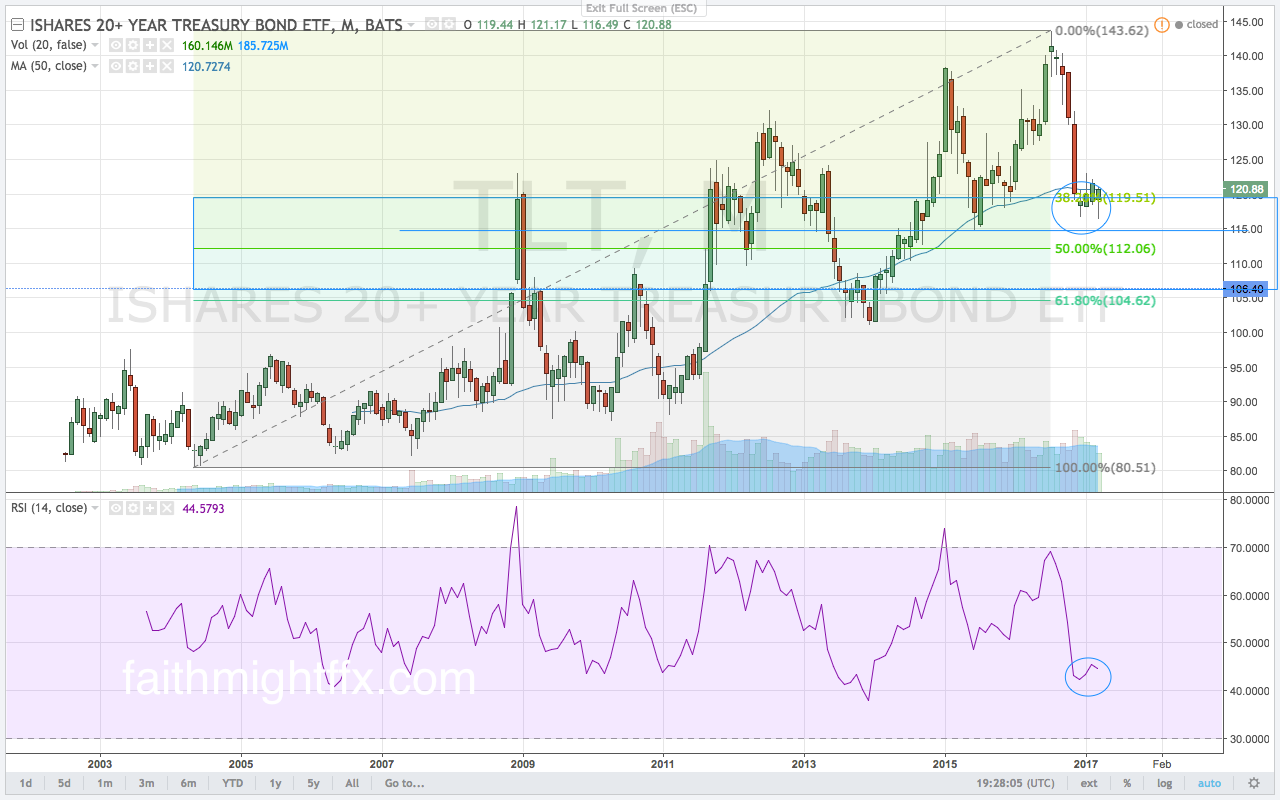
Taking a look at the $TLT as a proxy for all long-term Treasury bonds, we see that bond prices have risen dramatically in the aftermath of the 2008 financial crisis. Most recently, however, prices have taken a beating since the election of Donald Trump. Many screamed it was the end of bonds and the start of a new bearish cycle in the bond market.

tlt

I just don’t believe it. Looking long-term, bonds have simply corrected from all-time highs (in the $TLT). Prices have settled in the Fibonacci levels drawn off the entire rally in bond prices since the lows in 2004 (again, according to the $TLT). In fact, bond prices could certainly go lower from here… and still be in a correction. So I hesitate in calling the end of bonds as we know it. Rather, it could be just the beginning….of new life in bonds.