fbpx

NZDUSD Gradually Going Bullish

There has been low volatility with the $NZDUSD pair from December 2018 to the end of March 2019. Towards the end of March, the dip in price made $NZDUSD reach 0.64896 from the major resistance of 0.69362. The trendlines have been broken to the upside indicating a change of trend. In the first week of June, price was able to reach the middle line of the Bollinger bands. It tried to break it before a correction occurred.

NZDUSD Daily Chart


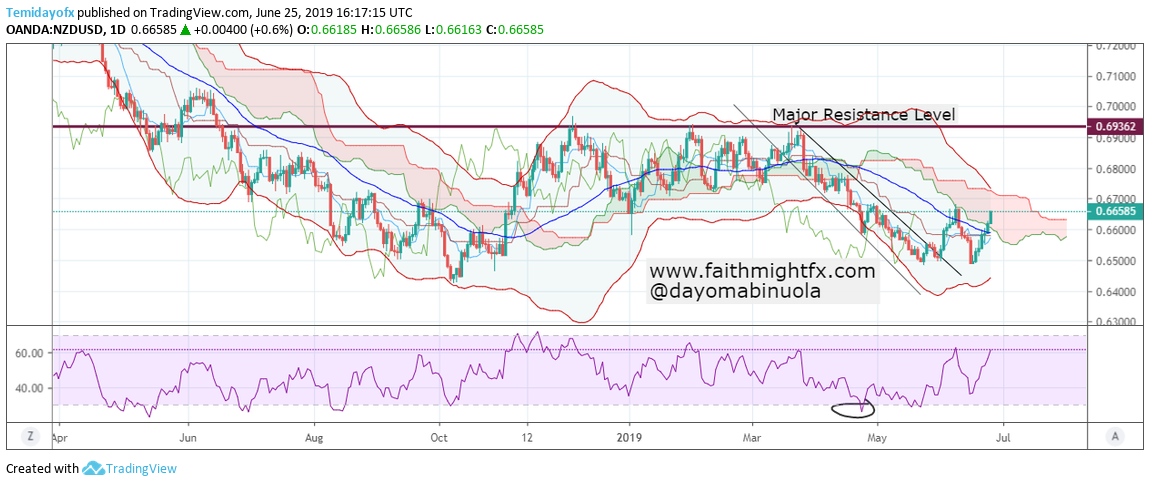
As it stands, in the last two trading days, price was able to break the middle line to the upside. The bulls might have been able to gather momentum for a complete bullish movement. RSI before the breakout from the trendlines has shown oversold positions. The NZD is presently gaining strength against the USD. Price of $NZDUSD might go back to the resistance level of 0.69362 in the next few weeks. Ichimoku still shows the bears are in charge. Though $NZDUSD price is presently in the cloud with the bulls in charge, a breakout from the cloud upwards might conveniently push price to 0.69362.

Microsoft Share Price Reaches New Resistance Level

Microsoft share price was able to attain an all time high in April 2019. The rise made $MSFT price reach a new resistance level at 130.24. The previous all time high was in October 2018 at a resistance level of 115.63. The price of $MFST has refused to cross over to the lower region of the Bollinger bands for over a decade. With the recent highs reached, price might cross to the lower region of the bands depending on the activities of the sellers.

MSFT Weekly Chart

The trendlines have been broken this week. This might be a likely change of trend where the bulls might reduce activities for the bears to take over. The future of Ichimoku has refused to show a downtrend despite a break down from the trendlines occurring now. $MSFT investors over the years have reaped a bountiful harvest in their investments. At several instances, the RSI has shown price of $MSFT to be overbought. The downward breakout might make price of $MSFT to reach 101.58 as the current market price stands at 124.76.

S&P 500 Might Continue The Dip

Some of the American stocks that had a strong bullish takeover are beginning to reverse in direction. This reversal might affect the $SPX. The $SPX price reached 2945 being our last analysis on $SPX in March shows it will reach 2946(https://faithmightfx.com/2019/03/13/sp-500-approaching-resistance/). That analysis was almost accurate. 2945 being the new resistance level of $SPX became the recent all time high price.

SPX Weekly Chart

A breakdown has occurred from the trendlines which shows a reversal has started. Price of $SPX is currently at 2765.5. The candlesticks have crossed to the lower region of the Bollinger band indicating the strength of the bears in the market. Ichimoku is yet to show a reversal of the uptrend. This time when price reached an all time high, RSI did not show us overbought positions. Also, the penultimate time $SPX reached an all time high in 2018, RSI never showed us overbought positions before a reversal. Though, this week, $SPX has shown the bulls might be trying to takeover. This might be a deceptive bullish move. Price might reach 2547 depending on the activities of the bears.

Aussie About To Appreciate Against The US Dollar


From mid-April, the USD has been gaining against the AUD. The $AUDUSD bearish turn made price reach 0.68636, the lowest since the early days of trading in 2019. Before the bearish turn, the volatility of the $AUDUSD pair had been low, causing price to be in a range. Price is currently in consolidation after the downtrend, providing trading chances for the bulls.

AUDUSD Daily Chart

The downward movement has made RSI reach an oversold position. The Ichimoku cloud still shows a bearish future. $AUDUSD might be gaining momentum for a bullish takeover after price broke out from the trendlines last week. As the $AUDUSD bulls are beginning to get into the market, efforts could make price return to the resistance level of 0.71769 from its current 0.69212. As we expect a major bullish trend, a reversal might occur after price touches the resistance level.

Euro Rallying Against The Swiss Franc


EUR/CHF has been on a downtrend since mid-April. Price of EURCHF moved from 1.14522 to 1.12599. The resistance level has been maintained around 1.14217 since August 2018. Despite the recent downtrend, price has not exceeded 1.1320 for the past one week. From mid April to mid May, price of $EURCHF was in a range before the downturn began.

EURCHF Daily Chart

A breakout has occurred from the trendlines which might make the price of $EURCHF to go north. As we expect price to reach the resistance level at 1.14217, price of $EURCHF has since maintained the lower region of the Bollinger bands around 1.12793. RSI on the daily chart has shown an overbought position but has not been able to show an oversold position despite the downtrend. A likely reversal might have occurred since a breakout occurred today and an additional indication of Ichimoku showing a bullish future. Price could reverse to the resistanece level of 1.14217 from its current 1.12793 as the bulls take charge of the $EURCHF market.

Euro Rallying Against The Swiss Franc

EUR/CHF has been on a downtrend since mid-April. Price of EURCHF moved from 1.14522 to 1.12599. The resistance level has been maintained around 1.14217 since August 2018. Despite the recent downtrend, price has not exceeded 1.1320 for the past one week. From mid April to mid May, price of $EURCHF was in a range before the downturn began.

EURCHF Daily Chart


A breakout has occurred from the trendlines which might make the price of $EURCHF to go north. As we expect price to reach the resistance level at 1.14217, price of $EURCHF has since maintained the lower region of the Bollinger bands around 1.12793. RSI on the daily chart has shown an overbought position but has not been able to show an oversold position despite the downtrend. A likely reversal might have occurred since a breakout occurred today and an additional indication of Ichimoku showing a bullish future. Price could reverse to the resistanece level of 1.14217 from its current 1.12793 as the bulls take charge of the $EURCHF market.

Verizon Now On A Downtrend


Each time price of Verizon attempts to reach the resistance level of 61.10, price of $VZ retraces. This happened twice in the past 8 months, majorly in November and March. When the price of $VZ closed the 2018 trading year, price showed a trace of reversal. The price of $VZ closed at 56.28 on the 31st of December 2018, after a bounce occurred from the support level. As price remains in the cloud of the Ichimoku, a breakout downward from the cloud could lead to a continuous downtrend.

Verfizon Daily Chart

$VZ has already shown an overbought position on the RSI chart. The current support level stands at 53.07. The price of $VZ may fall further after price has already crossed to the lower region of the Bollinger band. Ichimoku already shows a future of a downtrend which might increase in the next few weeks. Price is yet to reach the oversold position on the RSI chart. Since the trendlines have been broken to the downside, price may continue to go downwards to reach 51.08 from its current 56.91.

Walmart Has Lost Its Uptrend Grip

A resistance level of 103.95 was reached on the 25th of April 2019. For the most part of 2019, the Walmart bulls have been in charge of the market . A gap down occurred on the 26th of April, after which a temporary correction occurred. There was a very low volatility in the price movement of $WMT from mid February to the end of March. The share price of Walmart is beginning to drop after a bounce downward occurred at the resistance level.

Daily Walmart Chart

A breakout from the trendlines occurred to the downside which also complements other indications that the price of $WMT has begun a downtrend. RSI has been able to show an overbought position on the chart. The future of Ichimoku shows the $WMT bulls are still in charge of the market. Also, price maintains the upper part of the Bollinger band, which is yet to cross lower. The bears are gradually taking charge of the market.

Google Recently Had A Huge Gap Down

Our last analysis on Google shows the share price was going to rise. . Price was able to go beyond the expected resistance level of 1123.23. The bullish movement from last year was able to reach 1288.30 on the 29th of April 2019. At the last trading day of April, a gap down occurred which confirmed the beginning of a downtrend. RSI at two different occasions between March and April had shown overbought positions.

Google Daily Chart

Ichimoku is yet to show a reversal, but shows the $GOOG bulls are still in charge. The gap down which occurred made price of $GOOG on the Bollinger band to cross to the lower region of the chart which is presently in the Ichimoku cloud. The share price of $GOOG is currently at 1168.89. Now that price has crossed to the lower region of the Bollinger bands, this could make price to continue to fall more to 1106.41. $GOOG lost about 100points after the gap down. As we await price to continue the downward trend, it might still lose 150points more.

Netflix Might Be Ready For A Dip in Price

The Netflix stock price in 2019 has been majorly characterized with a stable market price. This occurred as a result of an uptrend that began at the latter part of December 2018. Initially at the beginning of the year, when the price of $NFLX rose, it reached an overbought region on the RSI. Instead of the price of $NFLX to fall, price continued to go upward at a very slow pace. Since February, price has consistently been ranging on the daily chart between 343.81 and 382.87.

Netflix Daily Chart

For the most part of 2019, the candlesticks have maintained the higher region of the Bollinger bands. Despite the trendlines being broken to the downside late last year, the price of $NFLX has ceased to fall. The future of Ichimoku does not show an actual direction of the market. Nevertheless, $NFLX might be losing its bull power temporarily. Price of $NFLX could fall below 351 in the coming days from its current 371.83.