This is the big question begging for answers in the heart of many traders and investors.
In the past, there had been many speculations predicting the price of Bitcoin to reach $100,000. Attempting to hit that $100,000, BTC reached the all-time high at $61,000 in March 2021. Since then, price has been retesting around $61,000.
Using the daily Chart, BTC in the past shows that price has been overbought. There are over 4 instances of price being overbought on the RSI with the bulls pushing price from $3,940 in March 2020 to $61,000 in March 2021. BTC has been able to do 15X since March 2020. The weekly time frame revealed the bull dominance since the beginning of the year 2020.
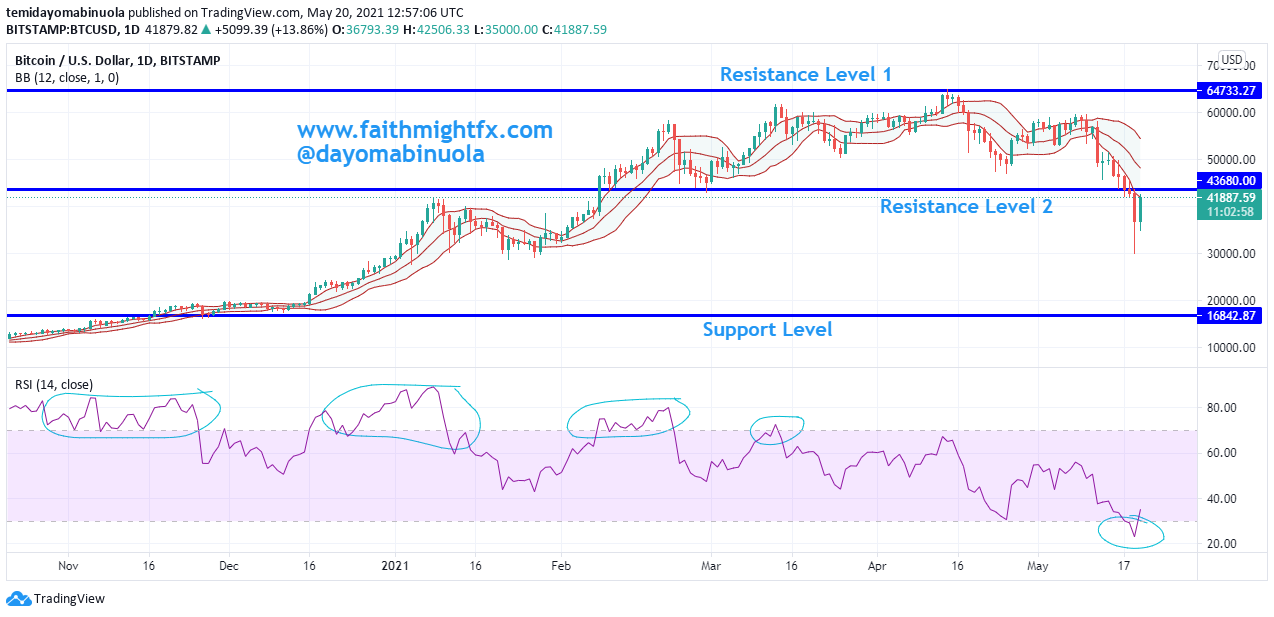
As it stands, the weekly charts show strong bearish dominance which might last for about a year or more. As price could not break the resistance level of $61,000 to the upside, throughout the month of May 2021, price has been ranging between resistance Level 1 and resistance level 2.
Yesterday, price was able to break the support level at $43,680. Many blamed Elon Musk for dumping the use of Bitcoin to purchase Tesla earlier in the week, which might have made $BTC to dip. The current price of $BTC is below $40,000, with the price of $BTC finding a new resistance around $43,680. A continuous dip might push price to $19,000.There is currently no bullish opportunity on the chart. A breakout of price to the upside, above resistance level 2 might push price upwards. However, the breakout might be a fake one.