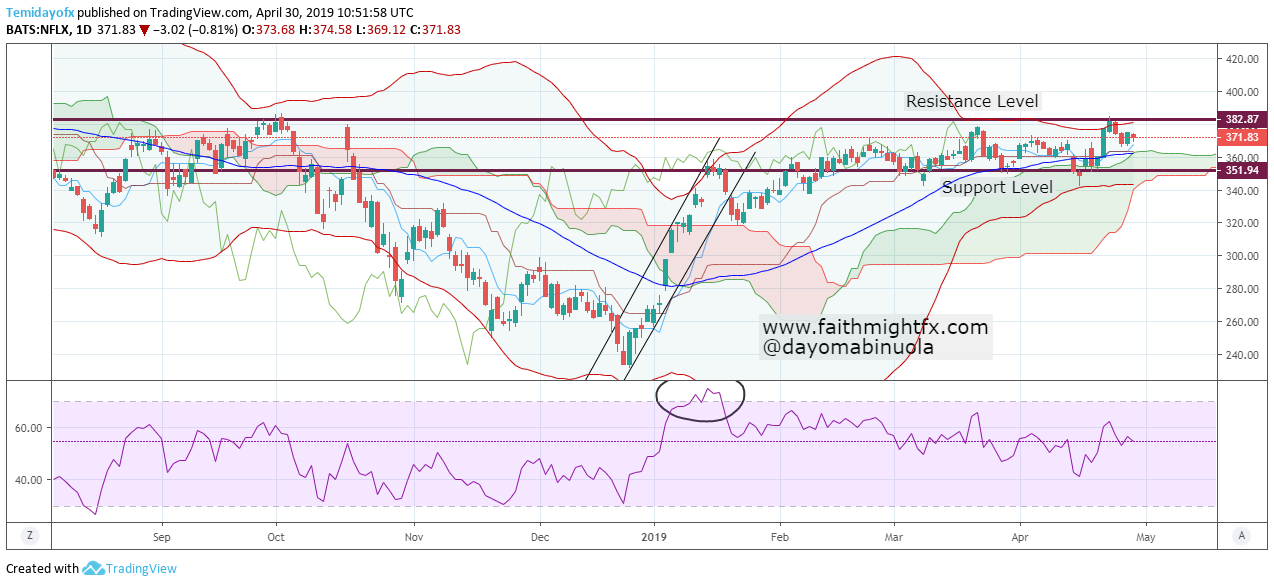
The Netflix stock price in 2019 has been majorly characterized with a stable market price. This occurred as a result of an uptrend that began at the latter part of December 2018. Initially at the beginning of the year, when the price of $NFLX rose, it reached an overbought region on the RSI. Instead of the price of $NFLX to fall, price continued to go upward at a very slow pace. Since February, price has consistently been ranging on the daily chart between 343.81 and 382.87.
For the most part of 2019, the candlesticks have maintained the higher region of the Bollinger bands. Despite the trendlines being broken to the downside late last year, the price of $NFLX has ceased to fall. The future of Ichimoku does not show an actual direction of the market. Nevertheless, $NFLX might be losing its bull power temporarily. Price of $NFLX could fall below 351 in the coming days from its current 371.83.
Undoubtedly, the year has been very good for the Exxon Mobil share price. Though in 2018, it was a rowdy chart with a majorly ranging market. The year has all been bullish for the $XOM from 71.25 to its current 82.90. The last time RSI showed either overbought or oversold region was in July 2017. The first resistance level has been reached at level 81.88. There might have been several looks of a reversal in price but as it appears, the bullish movement might continue.
We might expect price to reach 88.16 which is the second resistance level. Unlike last year, there is a lower number of ranging markets in the $XOM market with the bulls more active. The Ichimoku’s future has already shown a bullish signal which might be an indication for the bulls to continue trading. If price touches the second resistance level, by this time, the RSI might show an overbought position.
I kicked off the new trading week this Monday morning on the TD Ameritrade Network talking as one of the guests on the Futures with Ben Lichenstein show. Ben and I discussed the full gamut of fundamentals in the forex market for the Australian dollar, the euro, the Japanese yen, the Great British pound and the U.S. dollar.
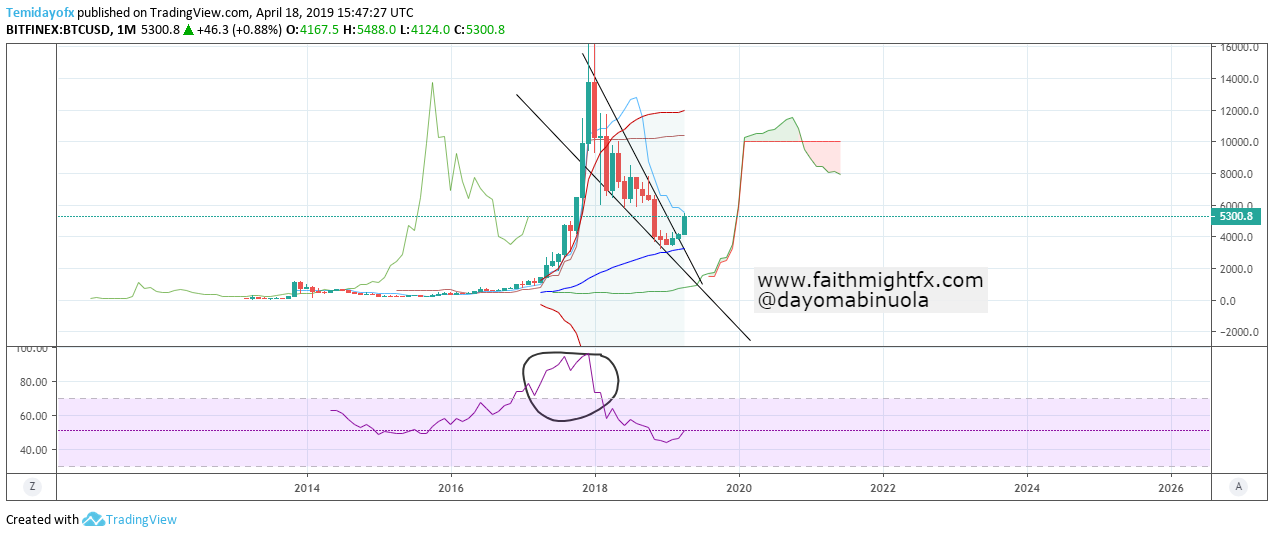
Almost all hopes were lost by investors when Bitcoin price took a dip. The year 2018 was hugely bearish for $BTC. $BTC’s dip was over 84% in a single year. In 2019, however, there have been low activities in the Bitcoin market. But in the last three months, the Bitcoin bulls are beginning to drive the market upwards. This recent upward movement might push the prices of alternative coins up. The price of $BTC on the Bollinger bands from the upper region of the bands is yet to cross to the lower region. A reversal might have just occurred because a breakout from the trendlines have occurred.
RSI is yet to show an oversold from the selloff which occurred last year. Ichimoku is yet to give a signal for a bullish move. With all indications, the price of $BTC might reach 10000 from its current 5,241. This might amaze you because hopes have been lost in the past few months. The long trendlines have been broken to the upward direction.
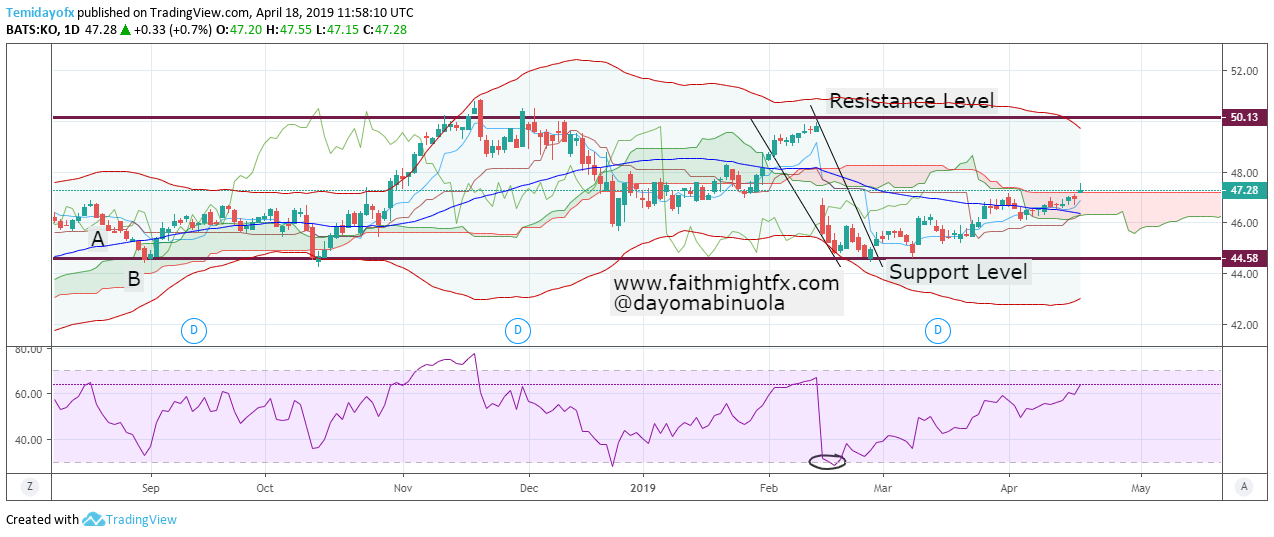
Coca Cola Share Price Remains Bullish A gap down occurred mid February causing the price of Coca Cola to plunge. The plunge did technically complete the M sign. The M sign is a trading pattern which after completion leads to a reversal. Nevertheless, price of $KO has been able to maintain the support level at 44.58. And price, has since the plunge, began an upward movement. This movement is quite slow but the bulls are heavily taking charge of the $KO market.
Ichimoku has refused to show a bullish signal to complement this uptrend. Price of $KO was able to close above the cloud which might indicate a continuation of the uptrend. RSI has been able to show an oversold position in the daily chart. Also, price of $KO has been able to cross to the upper region of the Bollinger bands. This might eventually make $KO share price to move just above 49.00 from its current 47.29.
The forex markets have been crap. And that’s just to say that for my trading style, I haven’t been able to trade much at all in the past several months. I know myself and I understand that the current market environment has not allowed me to trade my style. The major GBP pairs are all consolidating in the face of a now delayed Brexit, so there really hasn’t been much to do or say about the markets.
So I am thankful for the opportunity to make an appearance with Dale Pinkert and the Forex Analytix Community Experience (F.A.C.E.) during this time in the markets. I think it is important to share the ugly as well as the good in our process and to demonstrate that we don’t always make money at all times in trading. There are times when the best thing to do is really to do NO thing.
Enjoy!
If I can be of service to you, please do reach out. Happy trades!
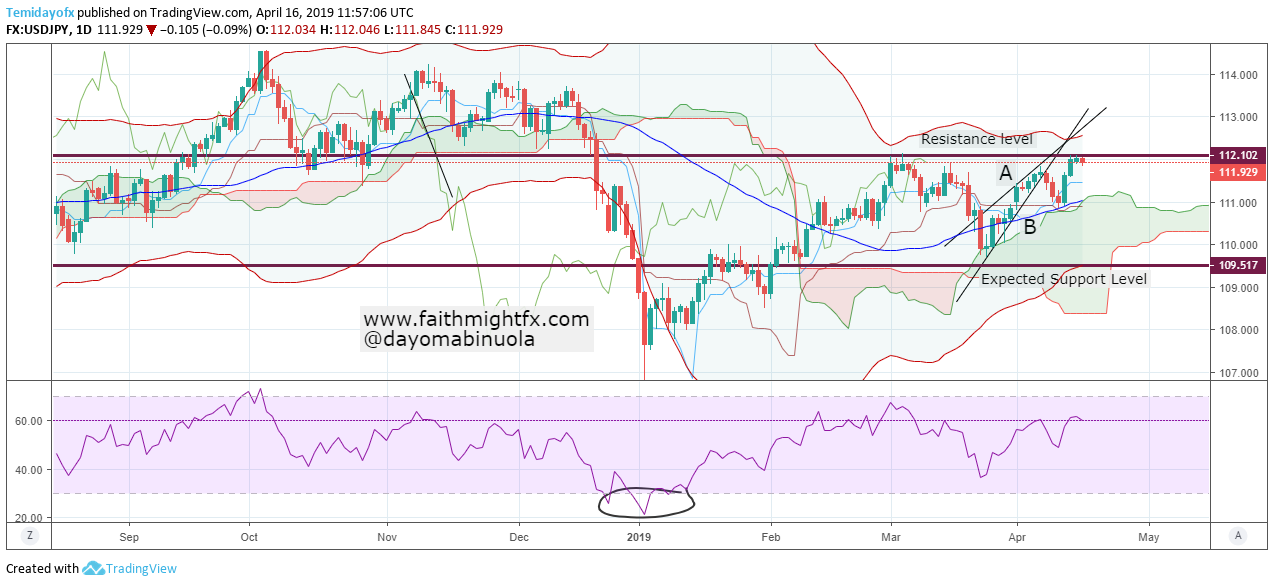
As the Yen is yearning for a rise in price against the US dollar, the US dollar was able to gain more than the Yen in the last one week. For the most part of 2019, the American dollar has gained about 4.914% against the Japanese yen, which signifies a bullish movement for the $USDJPY. Price of $USDJPY has failed to touch the upper line of the Bollinger bands despite the bullish movement. We have seen at two different instances that price of $USDJPY touched the resistance level line on the chart. Technically, it shows a double top, a strong indication of a reversal.
A doji has been formed after price touched the resistance level. Before the correction occurred on the 11th of April, price of $USDJPY touched the Bollinger band’s middle line. On the RSI chart, the price of $USDJPY did not show the overbought position on the daily chart. Also, the Ichimoku’s future still shows bullish strength, meaning the bulls are stil very much active. However, the trendlines have been broken to the downside on the 8th of April before a correction occurred. The expected support level is 109.517 from its current 111.932.
Jumia IPO’d on Friday, April 12th on the New York Stock Exchange. When news of its IPO first hit the wires, it was hailed as Africa’s first tech IPO. I will admit that I immediately bought into the narrative.
After all, I knew that it was (at one point) run by 2 Nigerian founders, Tunde Kehinde and Raphael Afaedor, and that, of course, it serves entirely African markets. Sounds like an African company to me! And if an African tech startup can exhibit a viable exit for investors, this $JMIA story could only help funnel more interest and capital to the entire African ecosystem. That is why the story really excited me.
https://www.instagram.com/p/Bu7ufUGljET/
Skip to the last video??
But by their own admission, $JMIA is not an African company after all. They are not headquartered in Africa, but in Europe. The company was not founded by Kehinde and Afaedor. Rather, those guys were hired to run Rocket Internet’s new e-commerce business it created and named Jumia. Given this (new to me) information, Jumia is very clearly not an African company. And that is OK! I’m not sure why the current executives feel the need to co-opt a brand identity that is not theirs. (And before you go there, Rocket Internet is also a European company.)
Unfortunately, I believe this narrative actually hurts the African ecosystem more than it helps. Because venture capital is such a pattern seeking (copy cat) business model, non-white, non-male founders have historically had much difficulty securing much needed funding to expand their businesses. My initial thoughts were that an actual exit evidenced by this $JMIA IPO will help convince investors that startups on the continent are viable investments. However, $JMIA merely reinforces the stereotypes that white male executives of a company domiciled in the West are the business models worthy of investment. This couldn’t be further from the truth.
I have been investing in African startups since 2012. And I am currently in stealth mode to expand this work on a larger scale. Stay away from African as an investment ecosystem if you want to. It only leaves more for me and mine. My friend and founder, Teddy Ruge, who of course opened my eyes to the real narrative around $JMIA sums it up best:
So. Focus on what's at hand. Build. Build. Build. Build. Build. Look up long enough to slap the next thief right across the mouth who dares claim what's yours. But build. It's in the building that we win. Otherwise, they want us distracted. Fighting on THIER platforms. Distracted
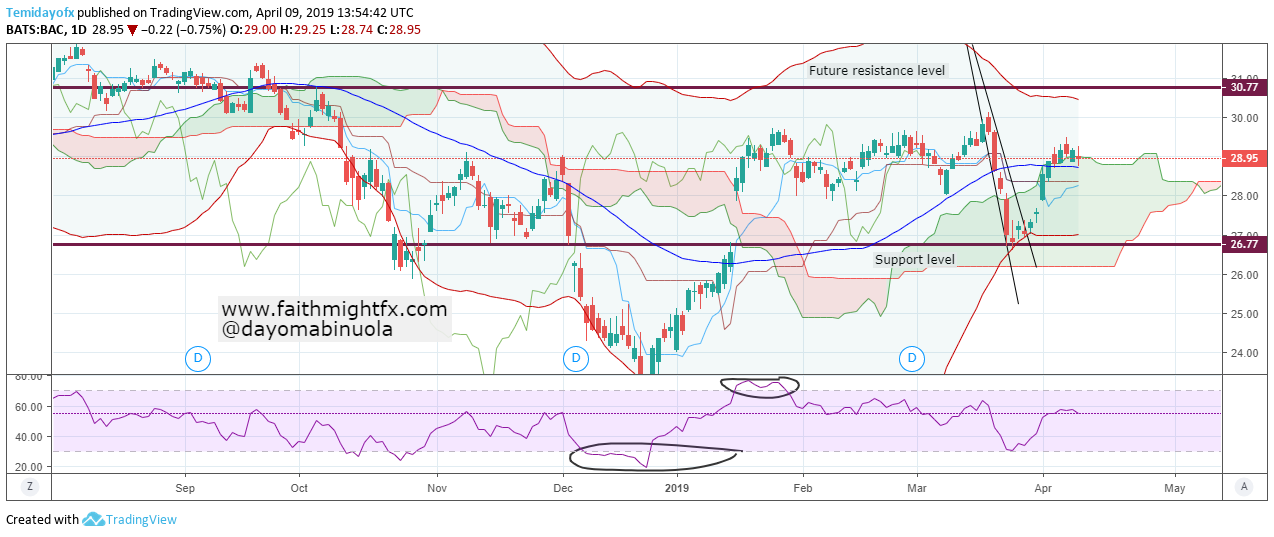
In December last year, Bank Of America share price was as low as 22.73. As the American market went down towards the end of 2018, $BAC also joined in the dip. After this dip, price rallied to the 26.77 level, which initiated to a strong support. There was a gap up on the 16th of January which made price to reach 29.64. After this gap up, a correction has occurred but the price of $BAC was not able to break the support level at 26.77.
The correction after the gap up made price to cross to the lower region of the Bollinger bands. The trendlines have been broken and indications show a bullish takeover begins. Though we expect the $BAC bulls in the market, Ichimoku has not shown a bullish signal but showed a bearish signal instead. On the daily chart, price of $BAC is overbought. Price being overbought might be deceptive for the bears to get into the market. Currently, price of $BAC has been able to cross to the upper region of the bands. So price of $BAC could reach the next resistance level at 30.77 from its current 28.95.
A major breakout occurred from the bullish trend between October 2018 and January 2019. After this breakout, the price of $USDCAD has been ranging on the daily time frame. At the beginning of 2019, the $USDCAD began a bearish movement. This bearish takeover lasted until the first trading week of March before price crossed over to the upper region of the Bollinger bands. On the 19th and 20th of March, price of $USDCAD touched the Bollinger band middle line from the upper region which is an indication for a reversal.
Since December 2018, RSI has indicated the overbought position has been reached. The future of Ichimoku still shows the bullish strength is still active though price is yet to cross to the lower region of the bands. Price of $USDCAD could reach 1.30445 from its current 1.33586. The battle between the $USDCAD bulls and bears in 2019 has been a tough one after price reached the overbought position in 2018. Price of $USDCAD might begin a bearish movement soon and a breakout of the expected support level might push price further downward.