The share of price of Boeing fell after two Boeing planes crashed in the past few months. In 2019, Boeing has been bullish from 315.80 and reached an all time high this year at 447.12. A gap up that occurred in the last few days of January has been filled in March. The price of $BA has been on the upper region of the Bollinger bands throughout the year until mid-month of March. The volatility of $BA in 2018 was quite low until this year.
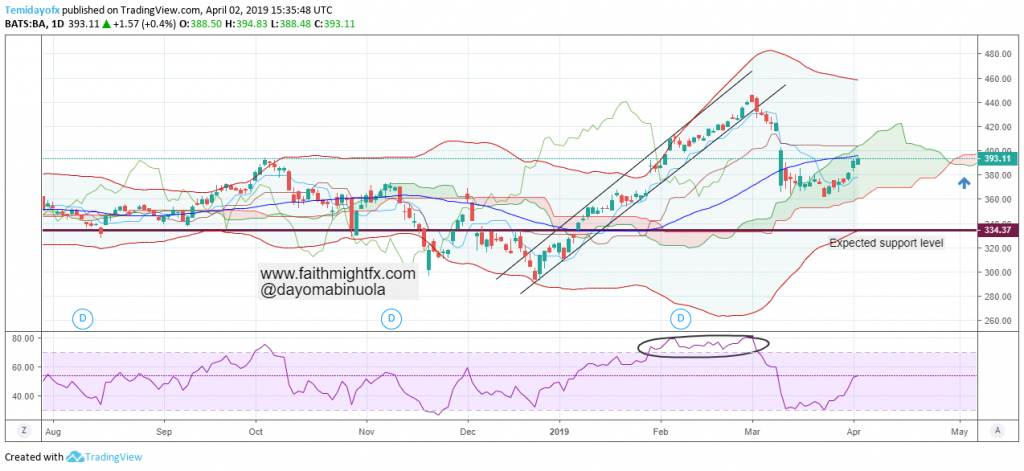
Throughout February, the price of $BA was overbought on the RSI. The future of Ichimoku has already shown a trace of downtrend. With the analysis using the trendlines, price of $BA could begin to fall from its current 393.26 to 333.71. The price of $BA has crossed to the lower region of the bands. If price of $BA breaks to the downside to reach the expected support level of 333.71, a breakout of the support level could make the price of $BA to continue to move downward.