fbpx

S&P 500 Approaching Resistance

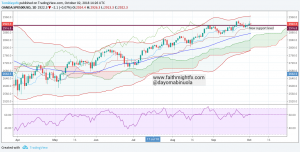
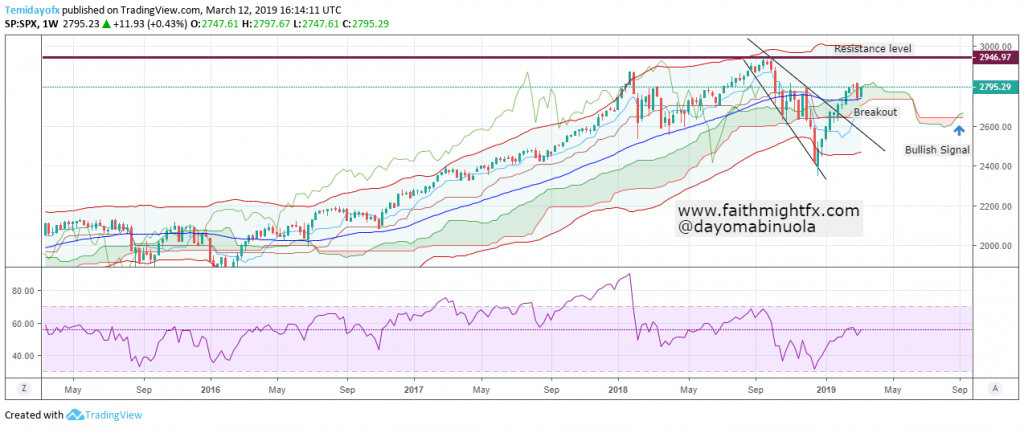
In the first week of October 2018, S&P 500 reached an all time high of 2946.97 before a reversal began. Before then, there was an indication of an oversold region in January 2018 on the weekly chart and price of $SPX moved downwards with 500points. Also, before the end of 2018, price was beginning to gain momentum through the active roles of the bulls.

Despite the selloff on the weekly chart, $SPX never showed an oversold position on the RSI before price rallied. A breakout from the trendlines which has occurred might be a strong signal for a bullish continuation move towards the resistance level. The future of Ichimoku has already given us a signal for a complete bullish takeover. In the second trading week of February, price of $SPX moved to the upper region of the Bollinger bands and it is yet to reverse. $SPX bulls might push price to 2946.97, the all time high.

ON THE AIR with Benzinga #PreMarket Prep Show

I got to open up the new trading month of February with the guys at Benzinga, just after the release of the US jobs report. The headline number smashed market expectations with the U.S. economy adding 304,000 jobs in the month of January. However, the more interesting number is the decrease in hourly earnings, which is a key indicator of inflation for the Federal Reserve. It makes us wonder if the Fed is trying to get ahead of deflation with its surprise shift in monetary policy just days earlier.

We also discussed the Brexit, monetary policy and what this all could mean for the euro! (Yes, of course, we talked about the GBP too ??) Watch the full interview below!

My 2019 Outlook

Despite today’s New Year’s Eve rally, sterling has closed 2018 at some of the lowest levels seen since 1985. That’s not insignificant. And given that we still have Brexit drama, the U.S. government shutdown, crashing equity markets and tightening monetary policy even if through unconventional means, 2019 is not shaping up to be a bullish year for sterling.
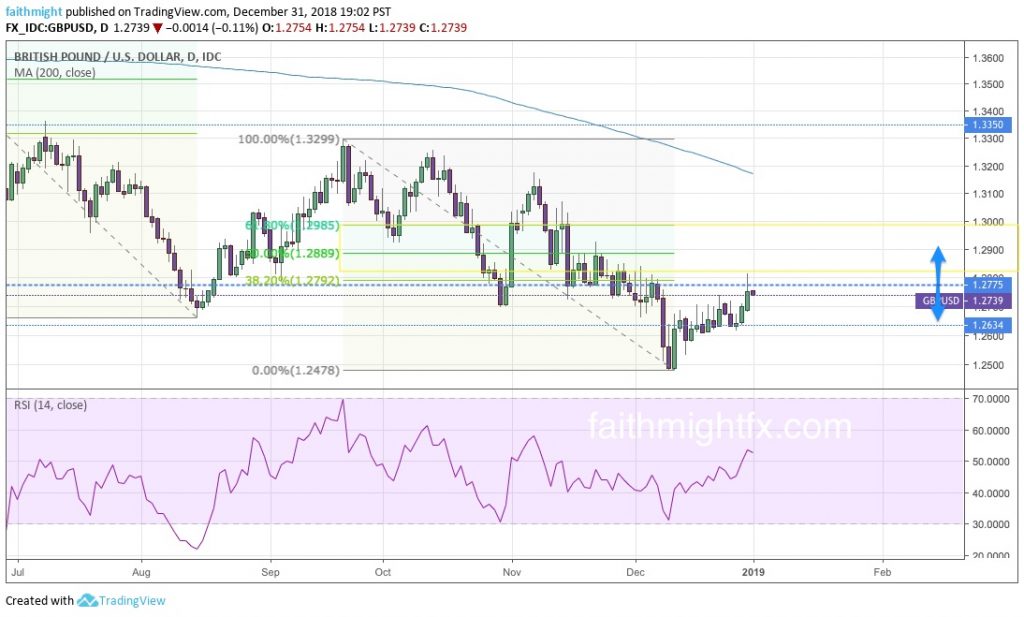
GBPUSD DAILY CHART

PREDICTION: The $GBPUSD will continue to rally to the 50% Fibonacci retracement level pictured above at 1.2889. Because the markets like to be cruel, I can see it moving even higher to the 61.8% Fibonacci level. At that level, so close to the major psychological level at 1.3000, bears start to turn bullish and major stops get tested. Just when it seems like sterling will really make a bullish reversal, it will plummet to make new lows at 1.2250. Later in the first quarter as the Brexit deadline approaches, the 2016 Brexit referendum lows at 1.1950 (depending on your broker) will be probed. The market’s reaction to the Brexit deal that does finally materialize will determine where we go from there.

The euro celebrates 20 years this year! And its 20th birthday may be a good year for the euro, particularly against this GBP weakness. But the $EURGBP remains fairly rangebound to start the  new year. In fact, it has been rangebound since late 2017 after reaching new highs at 0.9306. However, it is a bullish range as this sideways action for the past 2 years has never managed to move low enough into the Fibonacci retracement levels on the weekly chart.
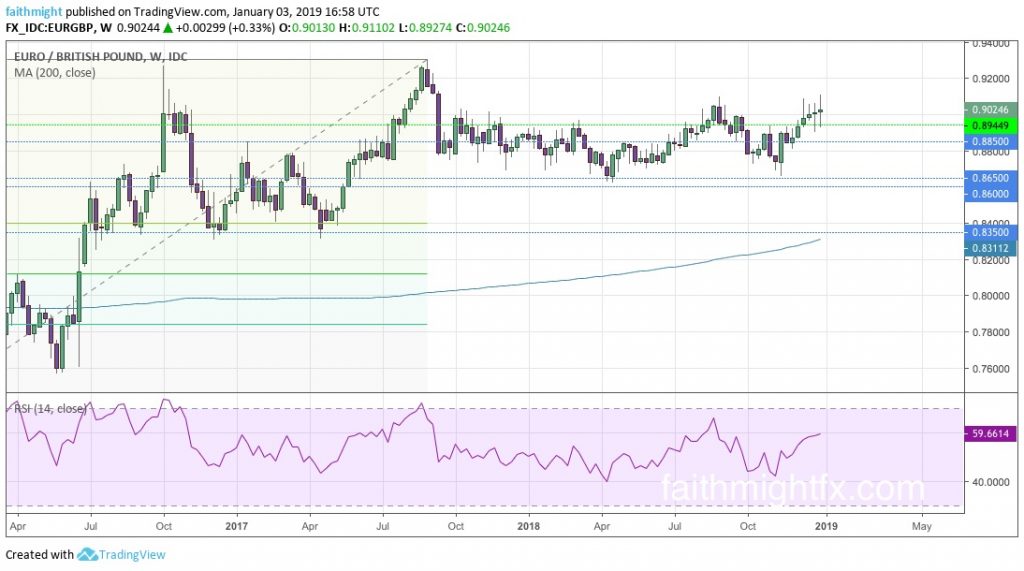
EURGBP WEEKLY CHART

PREDICTION: The $EURGBP continues to move higher. But it will be a grind and stair step higher as the markets contend with European politics in France, Italy and Great Britain. When the market finally resolves this 2-year long consolidation period, the $EURGBP will reach and break above the 0.9306 highs set back in 2017.

Equities rocked investors in 2018 when it did not deliver the Santa Claus rally that investors have come to rely on for the past 8 years. Instead, we were greeted with the worst Christmas stock market when the S&P closed down 2.71% on Christmas Eve falling to 2346. It was the worst Christmas Eve ever since 1985 when it fell 0.69%.

The 2400 level is a huge level in the S&P 500 ($SPX). This level marks the 2017 highs where price stalled, consolidated for a few months, and then barreled through that resistance to then new all-time highs. Those December lows mark a level of real support that I honestly have had my eye on since 2017. At that time, I expected a correction in price lower. Rather, it was a correction through time as bulls continued to buy the dips. This year, 2019, however, is a very different market.
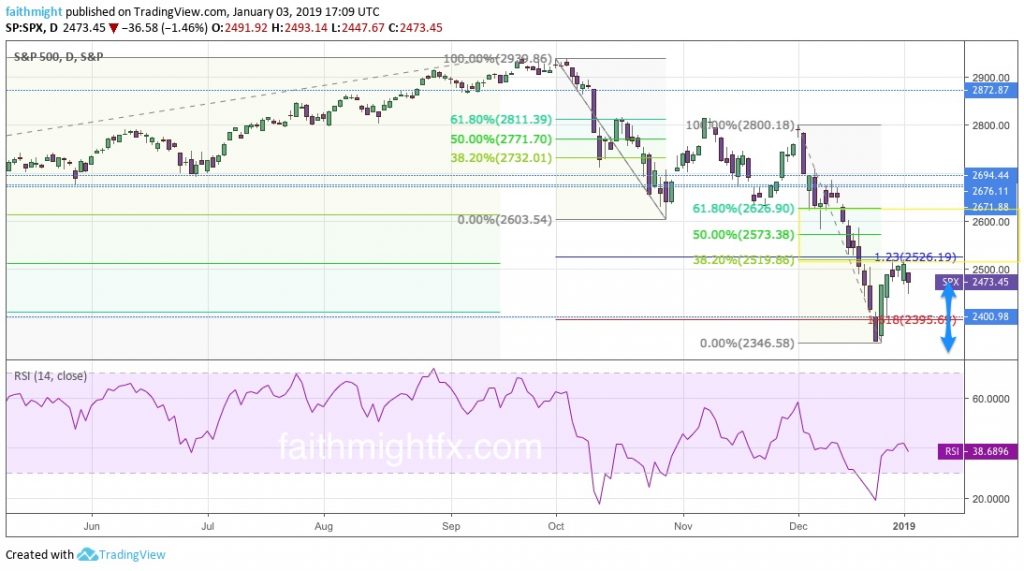
S&P 500 DAILY CHART

PREDICTION: It seems any corrective bounce higher will remain below the lows at 2600. Above the 2600 level, equities may be ready to start a new bull market. But if it can’t hold above that level, I would look for $SPX to make new lows below the 2400 level. A break below the 2346 low sees price move to the 2132 support level.

A discussion on stocks is just not complete without a mention of bonds. After peaking in 2016, $TLT plummeted just 2 months later. The $TLT was in a free fall right to the 116 support level where it consolidated before moving lower. Many cried that bonds were in a bear market and they would be right, looking on short to midterm timeframes. But on the monthly chart, $TLT was still in a correction (albeit a very deep correction). As such, the 2018 lows were very important. They marked the 50% Fibonacci retracement level on the monthly chart. It would have sparked mad capitulation had that level been breached.
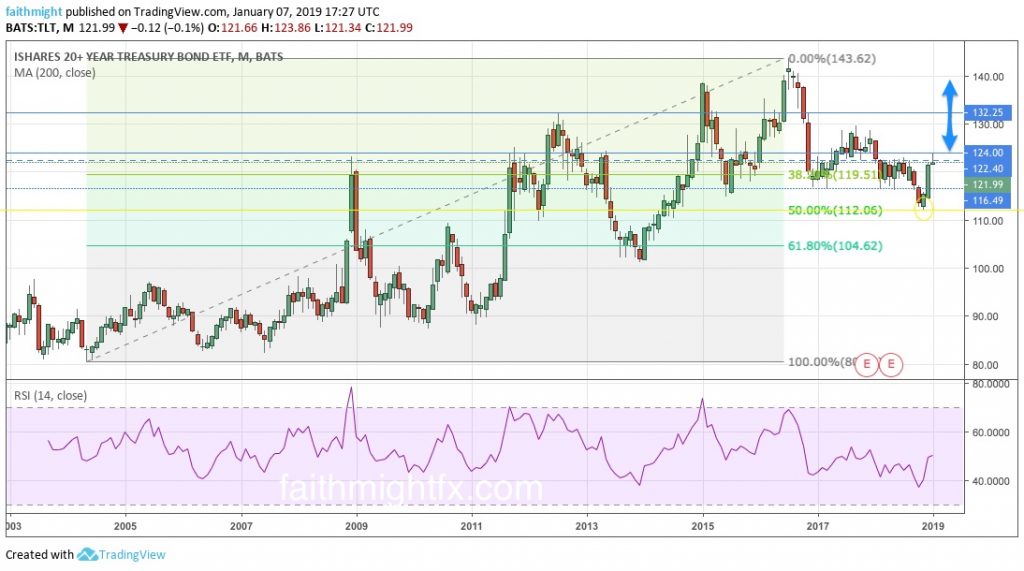
TLT MONTHLY CHART

PREDICTION: Now that price has moved back above the 116 support-turned-resistance level, $TLT looks well-supported to move much higher from current levels. I like a return to 130 in $TLT. A move above that psychological level clears the way to 132.25 where the market will have to make a decision. Depending on how investors are feeling about risk, price would need to hold above 132.25 for the bull move to continue higher and challenge the all-time highs at 140.13.

2018 was a year full of ups and downs. Nicely, most of those ups happened in my career. The downs last year really did make me stronger and propelled me in new directions that should be very good for the company and my career in 2019. Cheers to the new year! ?

Source: @cubewealth
Buyers Are Optimistic In The Growth of SPX

Stocks in the $SPX are yet to relax in the uptrend this year. A buy in the first quarter of the year could have resulted into meaningful gains by now. Howbeit, for the past 3 weeks, price has been in a range on the weekly chart. Last week, $SPX got to the highest price level ever. This is highly profitable for long term shareholders. Despite reaching an initial overbought point in January 2018, price has refused to fall. Instead momentum for an uptrend increases. $SPX was a bit above $2,930.00 last week. Price of $SPX might reach $2,990 before a complete change of trend.

Analysis with the weekly chart technically shows Ichimoku has a future uptrend. Price maintains the upper region of the bands. Price, after breaking out from the downtrend, is yet to be overbought. Price broke out from the support level last week and tried to retest on the line before a new breakout in the upward direction occurred this week, which might indicate a continuous uptrend.

ON THE AIR with FUTURES with Ben Lichtenstein

Yesterday, June 25th, was my 3rd time on this show. And it was my 1ST time feeling comfortable in front of the camera. A huge THANK YOU to Ben, Alex and the folks at TD Ameritrade Network. They kept asking me back, ha! That was a good sign after my initial appearance (which still makes me cringe lol). Thanks for giving me chance after chance.

My discussion with Ben focused on this week’s fundamental outlook. However, investors should watch these themes, not just for this week, but for this entire summer. Our investors spent the spring getting in position to take advantage of the summer opportunities brought about by active central banks, trade wars and risk aversion. Investors must always stay position to take advantage of developments as they come in markets. I talk to Ben about a few of them. Click the screenshot of my segment below to listen to the show.

CLICK TO WATCH THE FULL SHOW


There are ebbs and flows to every market. Trade what you see. Learn how. Invest with a pro. [sponsored]

Equities Get Healthy

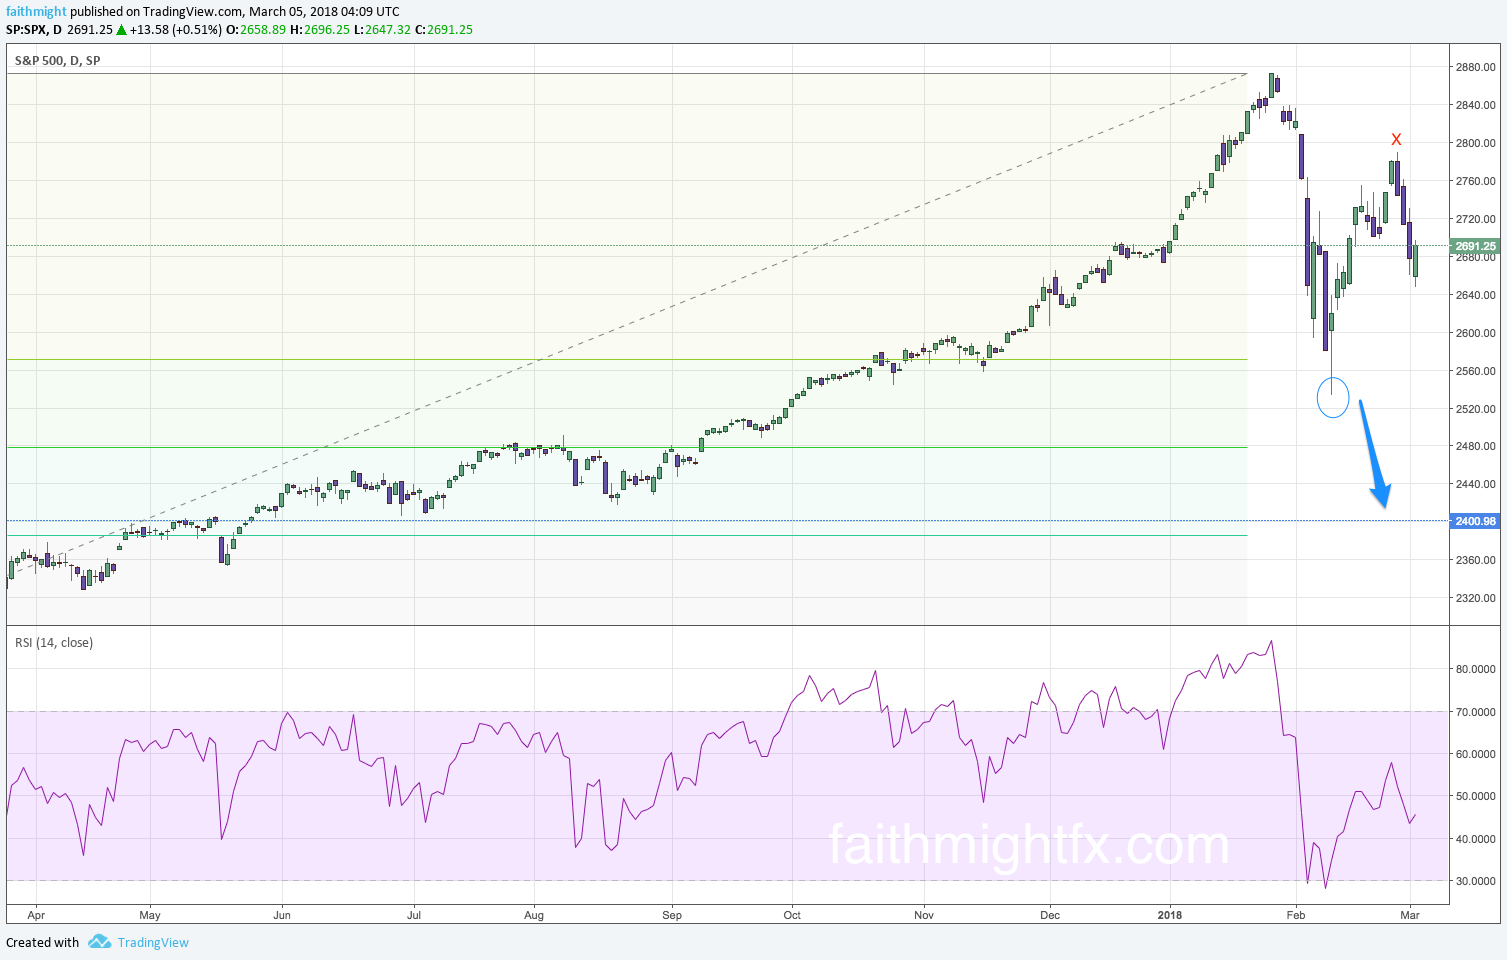
The stock market finally took a hit. The S&P 500 ($SPX) was down as low as 32% from the recent highs this year. A dip that finally really mattered still found buyers and equities attempted to move higher last week. However, 2 weeks ago it the first time that a buying frenzy after a big dip did not result in a new high (a price higher than the previous high price). This is a technical signal that may foretell a move much lower can occur for the U.S. stock market ($SPX).


SP500 daily chart

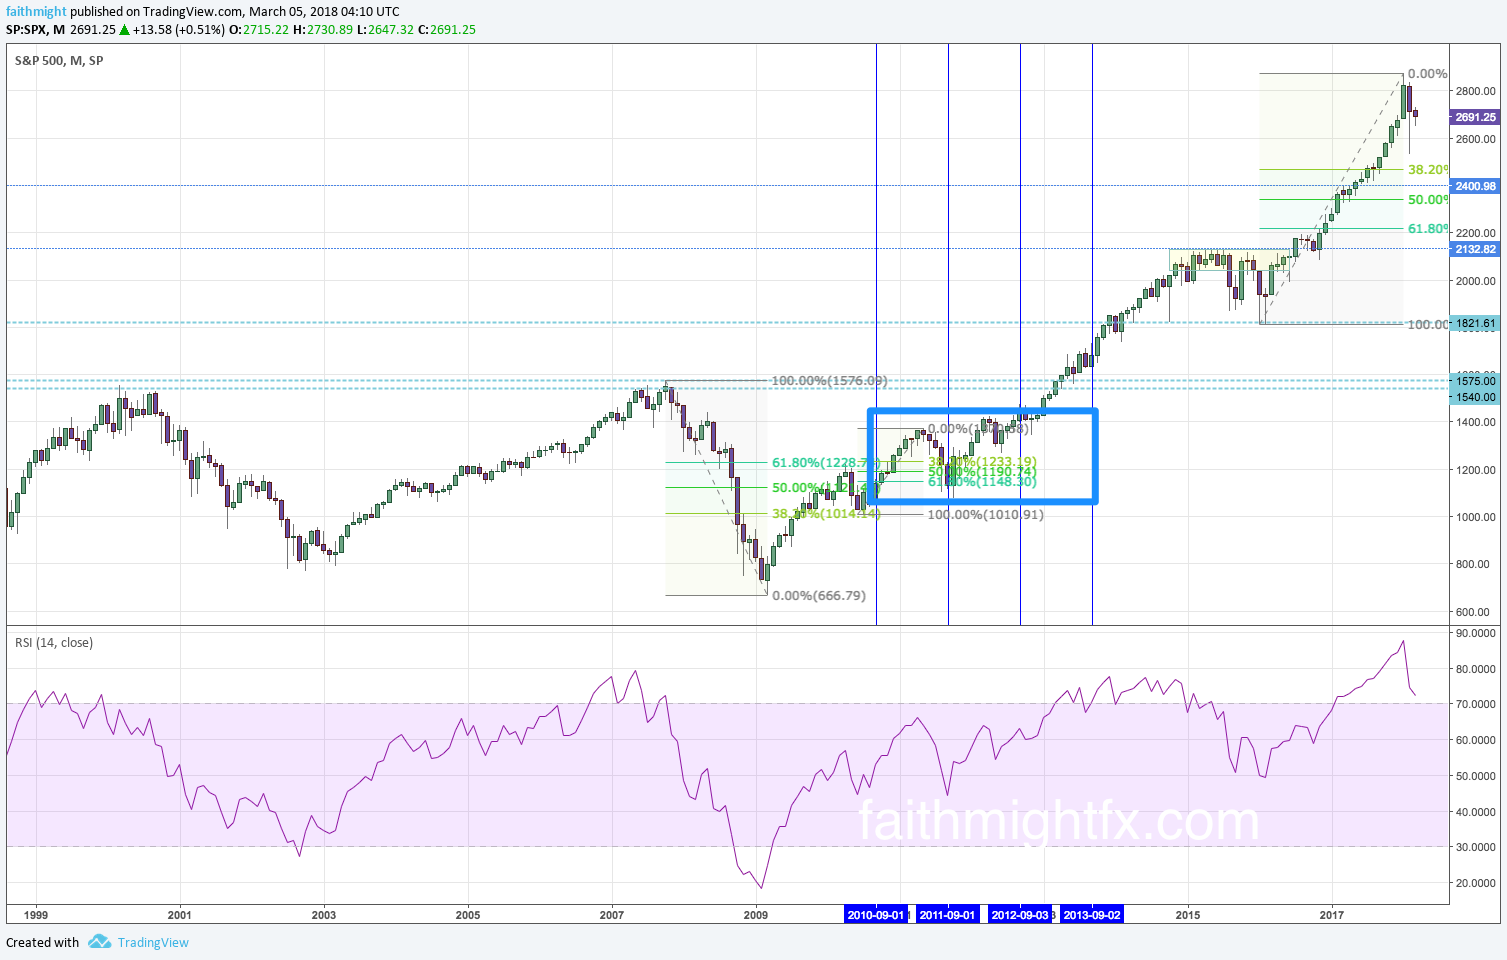
Now before you starting getting hysterical about lower stock prices, your long-term perspective becomes so critical when assessing whether current price action should actually prompt a response in your portfolio. If you positioned in this blue area, then this recent dip probably doesn’t bother you. However, if you have new money to put to work, it is important to pay attention to where equities make their next move.

SP500 monthly chart


As the Federal Reserve welcomes a new chairman and the markets grapple with possible trade wars and a ballooning fiscal deficit, make a plan for what to do with a $SPX chart at much lower levels. Many fund managers and traders alike, myself included, have been waiting patiently for equities to get healthy again. But trying to catch a bottom in a correction this deep will feel scary. However, at the right levels, swing traders will be right back in these markets again. The buyers will return. Be healthy, and smart, enough to see the opportunities.

There are ebbs and flows to every market. Trade what you see. Invest with a pro. [sponsored]

Intermarket Action Showing 1st Signs of Concern

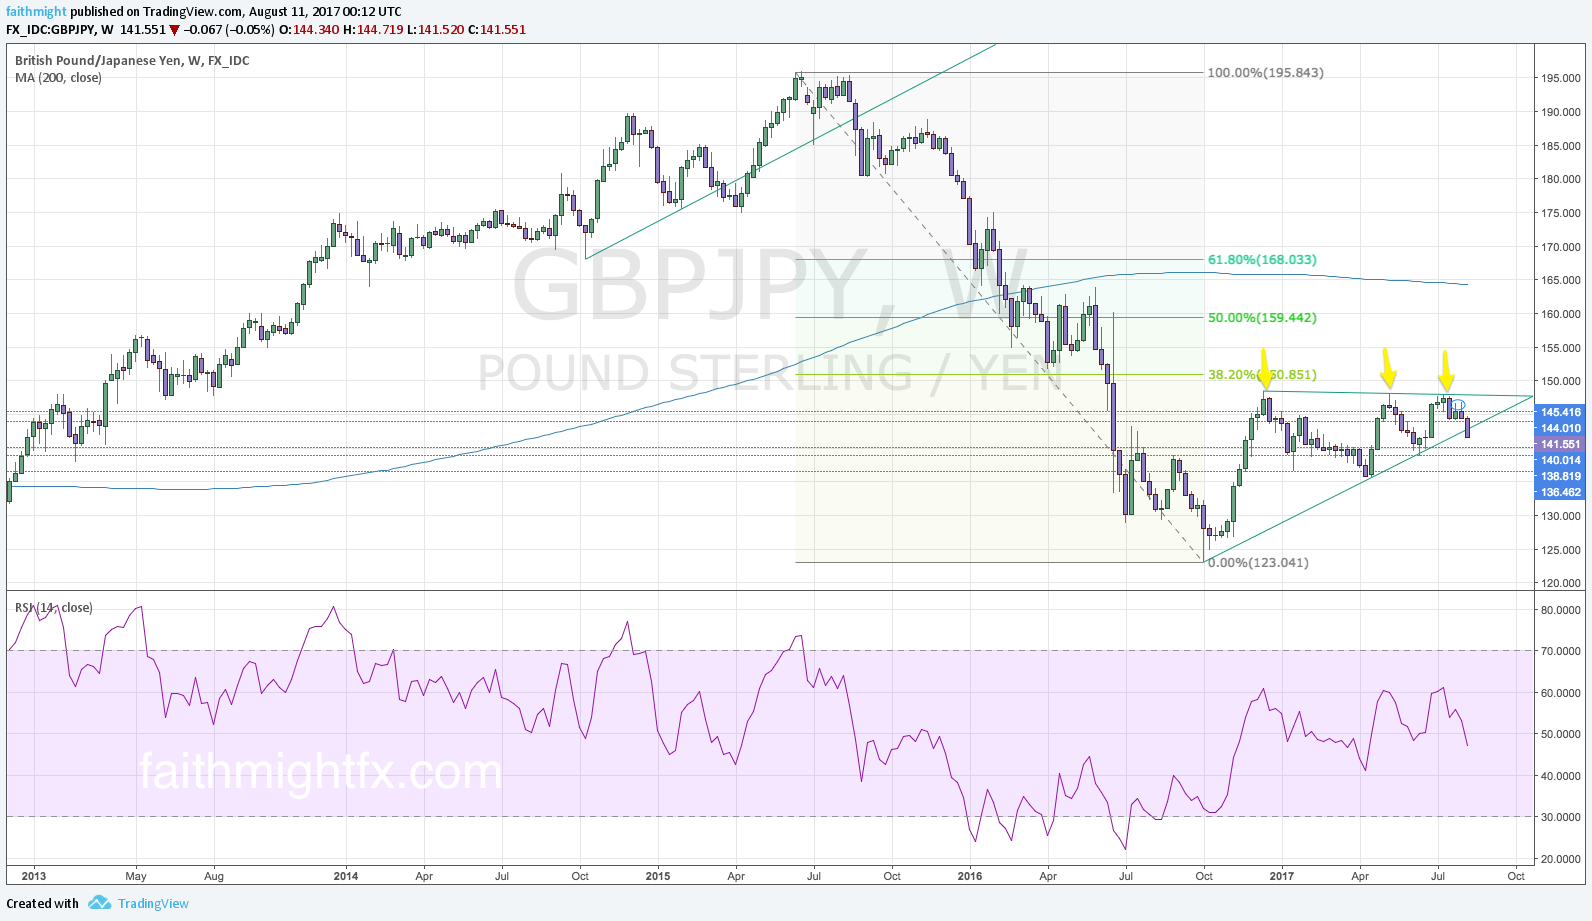
The $GBPJPY has a huge wedge on the weekly chart but it has been difficult to catch a move on this currency pair. Shorts at the top of the wedge just above 147.00 level had to contend with choppy price action. After a few weeks price finally broke down lower to the 144.00 support, and former resistance, level. The reason why I don’t think we’ve seen a huge correction is because we have been moving in such a way that allows momentum measured by the RSI to reset. With the measured move lower to the 144.00 support level. When the yen caught any kind of weakness, the $GBPJPY moved as high as 146.76, close to the former highs above 147.00 which are the former lows turned now resistance level. However, I think this one will just continue to grind lower. The price action has stair-stepped all the way down allowing momentum to progress naturally lower in the midst of this very measured move to the downside. Until this week.

GBPJPY WEEKLY CHART

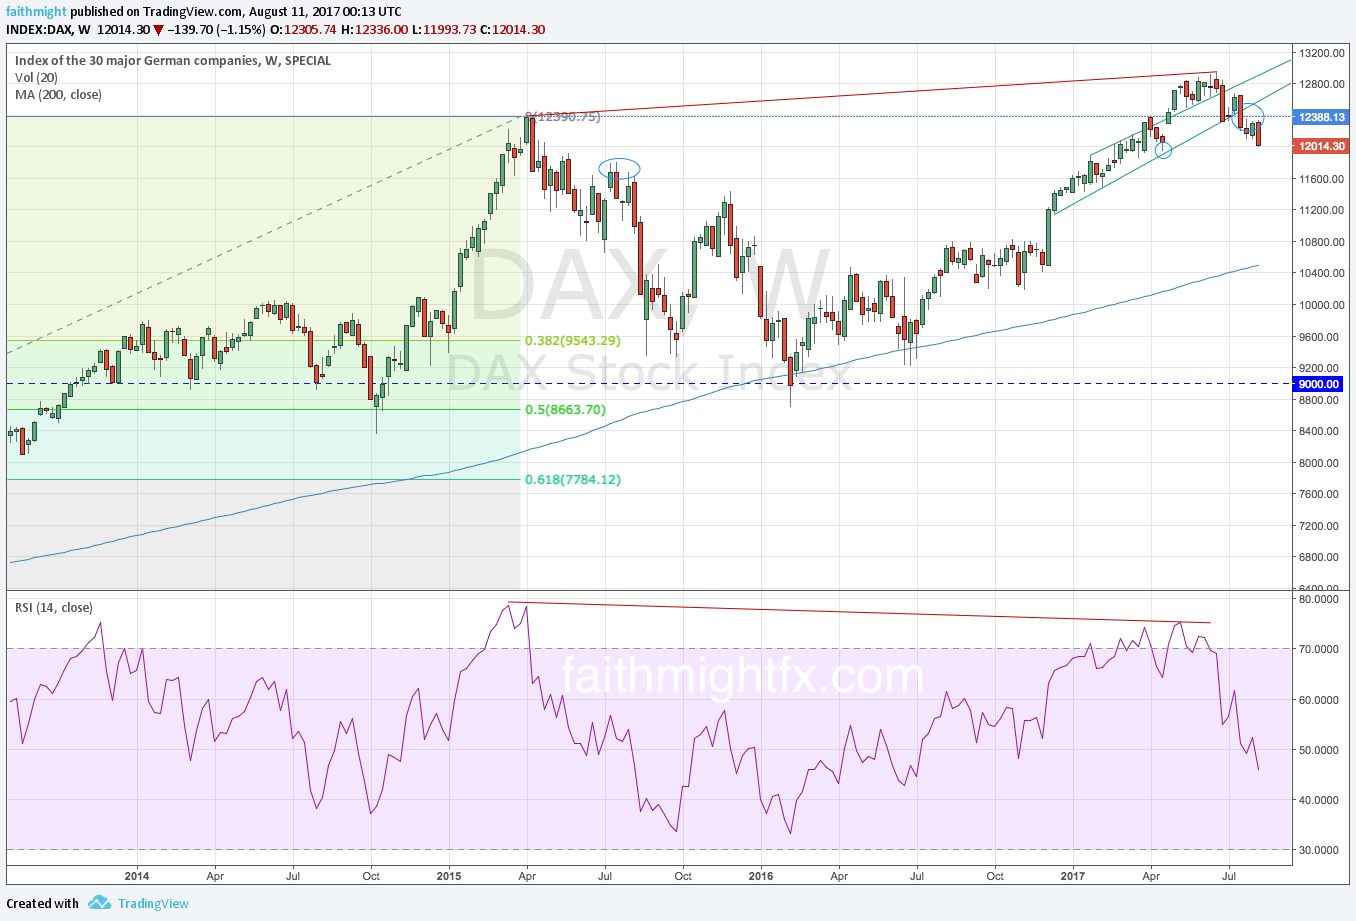
If you look at U.S. equities, the major American stock indices have been making new all-time highs all summer. Equities just keep grinding higher despite the divergence in momentum between price and RSI. The divergence has been recently invalidated with momentum make a new high higher than the previous high. However, the other equity markets in Europe, Great Britain and Japan have all failed to make new highs in tandem with the U.S. markets. In fact, the $DAX has already broken below recent lows and the $NIK has failed to move higher. The weak dollar has clearly supported U.S. equities higher. In converse, the strong euro has been killing European equities as of late. The forex market has certainly been a factor behind the divergence in western stock markets.

DAX WEEKLY CHART

SPX DAILY CHART

And in steps North Korea. The geopolitical tension between North Korea and the United States has been building for months. But this week, the warring ideologies escalated to fighting words. The market closed today below the summer highs for the first time since trump took office this year. This looks to be a first, early signal that the market is starting to crack. Will it be 2007 all over again a decade later? Get ready.

Is This The TOP?

No. But I got you to click on the article so thank you. And hear me out.

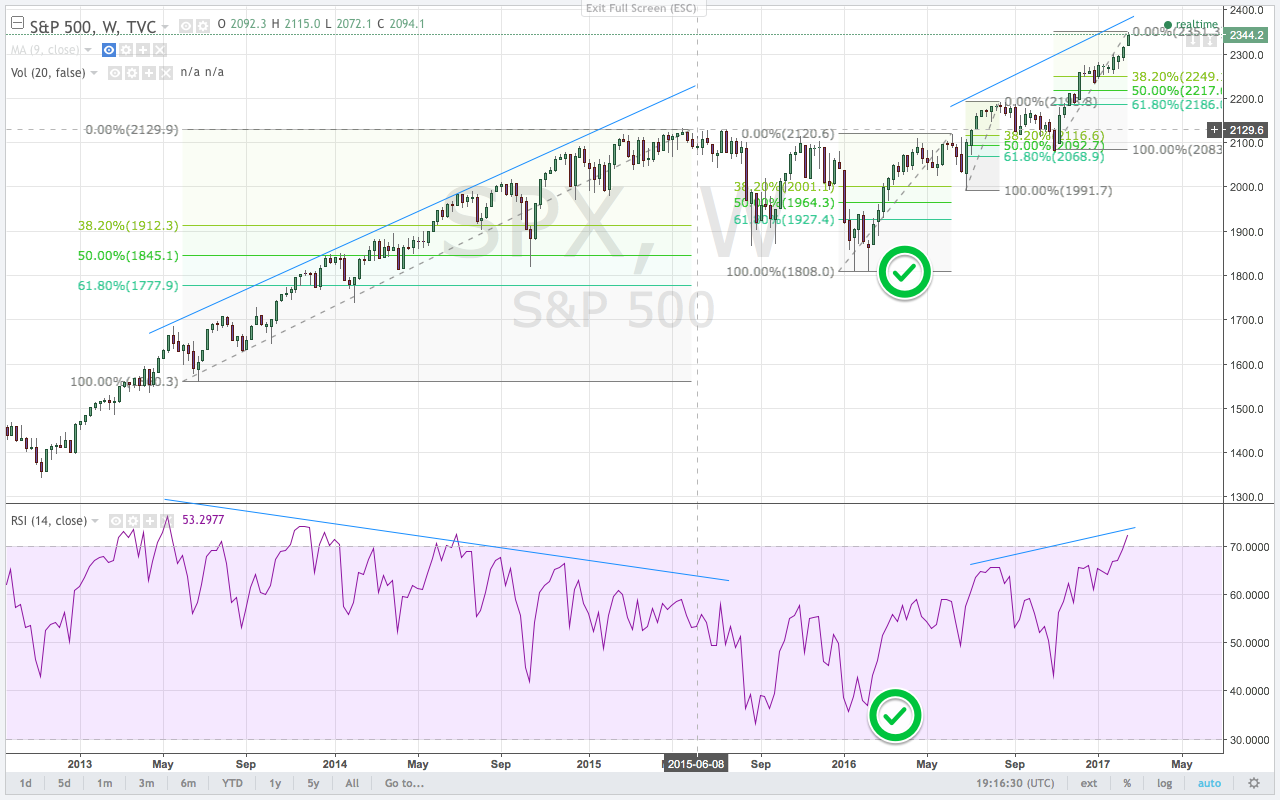
SPX WEEKLY CHART

Two years ago, the S&P 500 ($SPX) soared to then new all-time highs. But at that time, those new highs did not have momentum behind them. In fact, price diverged with momentum, measured by the RSI, for all of 2013 and 2014. It was finally in 2015 where equities started to falter. And at this time last year in 2016, prices in the $SPX fell over 14%. Some started to predict another stock market crash.

Instead, a couple things happened with the technical indicators that I watch. First, momentum had worked itself into bearish territory. So there was plenty of room at that point in 2016 for bulls to push price and still remain now comfortably bullish at even higher prices. That has panned out.

Secondly, the lows at the 1800 support level was a major support level. Price had dipped to this support level before and had held above it.

Lastly, the lows at 1808 also found support in the zone of Fibonacci levels. In fact the low is a pip shy of the 50% Fibonacci level. This weakness in stock prices proved to be a mere correction of the tremendous rally after the 2013 lows.

I say all that to make clear a very important point about today’s new all-time highs. There is absolutely none of that happening now. Momentum is supporting these new highs. The RSI is well into bullish territory and edging into overbought territory. An overbought market will eventually dip lower but it will be met with so many buyers who either missed this rally or are adding to their current long positions that the $SPX will quickly move to new highs again.

Regardless of what we think of the 45th president of the United States, it is only price that pays.


I am a registered investment advisor with FM CAPITAL GROUP. Our vision is to manage capital with the intent of building client wealth in investments that positively impact our communities.

Patience Required

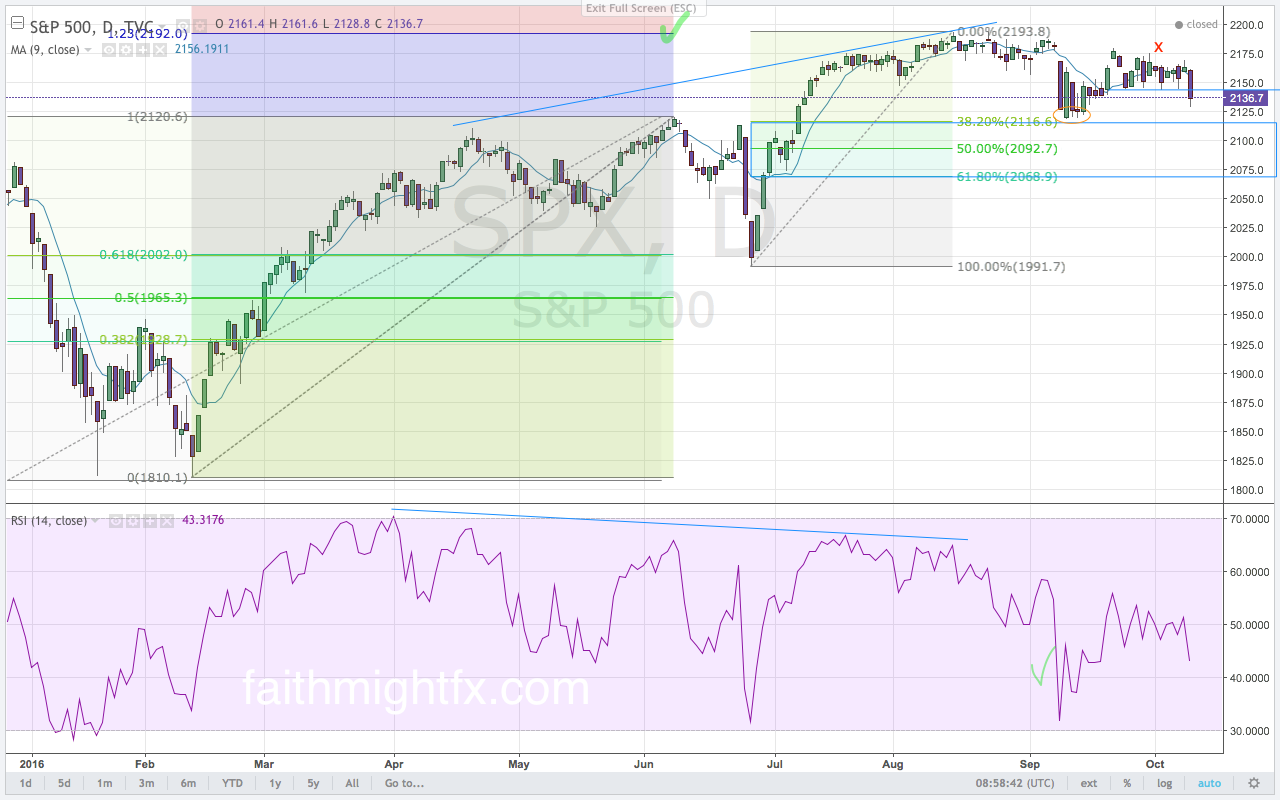
The S&P 500 ($SPX) is the U.S. equity index that I use to watch and gauge strength or weakness in the US stock markets. If we concentrate on just this year’s price action, the $SPX has put in a very impressive rally off the February lows. It is impressive for 2 reasons: 1) The lows were actually at a healthy Fibonacci retracement level of the monster rally in U.S. equities that occurred between 2013-2015; and 2) The rally has had 2 healthy corrections this year that have been largely supportive of the move to new highs at the 123% Fibonacci extension target of the 2013-2015 rally after the market fell in February.

But there has been something glaringly wrong with this rally even as it reached new highs. The momentum in this rally has not been supportive. As price moved higher, buying momentum was waning. A rally needs more, not less, buying momentum if it is to continue even higher. That is not what has been happening this year.

S&P 500 daily chart

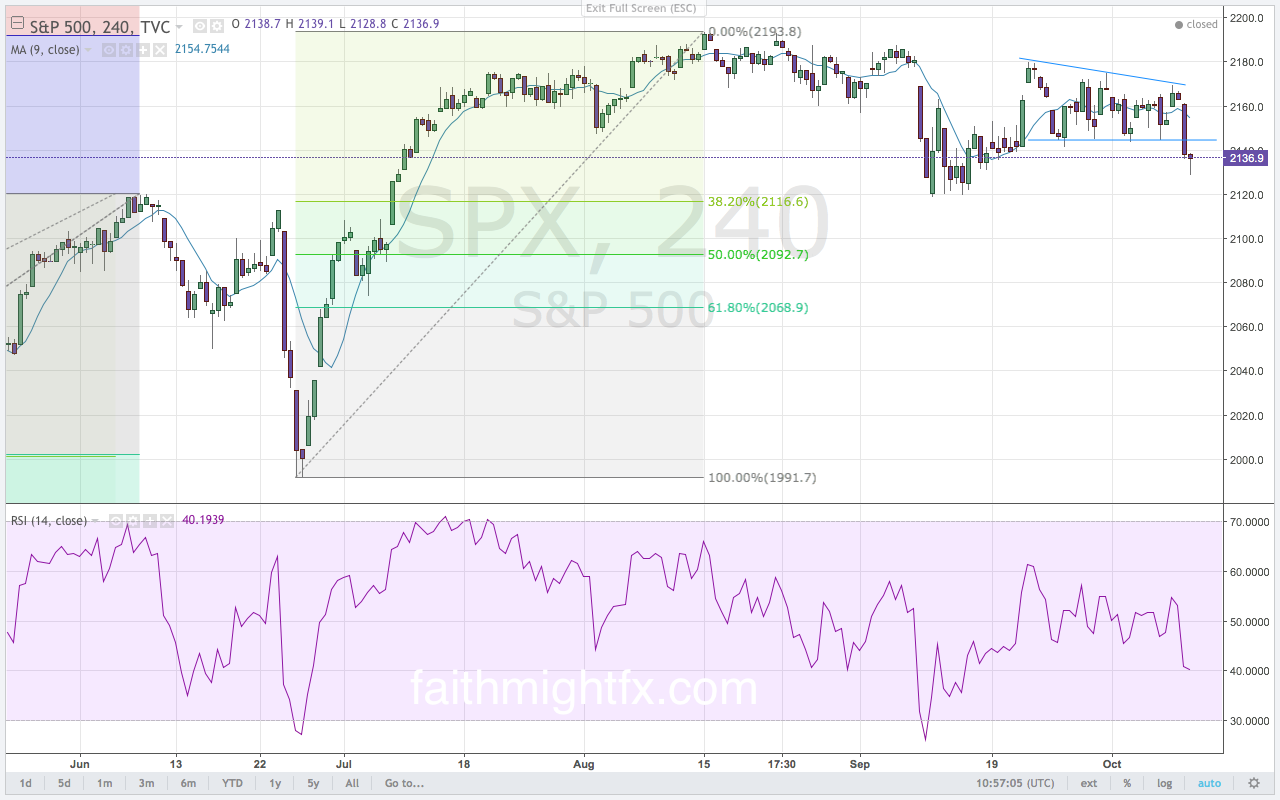
That lack of buying strength manifested finally when the market moved lower last month in September. After this decline, the market then moved in a choppy, sideways grind for 3 weeks. There just hasn’t been a move to take advantage of in either direction with indecision from both buyers and sellers. These failed highs signal a move below the 2120-level. It took almost a month but this anticipated move lower finally got started yesterday when the $SPX broke support around the 2140-level.

S&P 500 4 hour chart

So, as anyone can observe, it has been a tough market to buy since making the new, all-time highs in August. If the market continues to move lower, the news media will start to get louder with pessimism and bad news. Be forewarned and understand that that will be the precise time to shut off the TV and revisit your investment plan. Because even after the 2008 financial crisis, there was a buying opportunity. And what a buy it was. Don’t get scared of the next financial crash. Get ready.

S&P 500 MONTHLY CHART


#TBT to #FuturesRadio

I made my debut with the famous Anthony Crudele on #FuturesRadio last month just ahead of the Junior Olympics. It was an extremely hectic time and I know all my fellow “soccer” [insert any sport] moms and dads can relate. So I never got the chance to share this great interview that I had the pleasure to do. It was great to meet Anthony. He has interviewed many of the great traders on Twitter that I follow and respect. So when he reached out to me, I was thrilled to be considered.

The feedback has been awesome. Thanks to everyone who listened and shared it. Thanks again to Anthony. THANK YOU!

ON AIR with Futures Radio

Subscribers receive my research on all major GBP pairs at the beginning of the week, including access to @faithmightfx on Twitter for intraweek updates on the pound. AVAILABLE NOW.