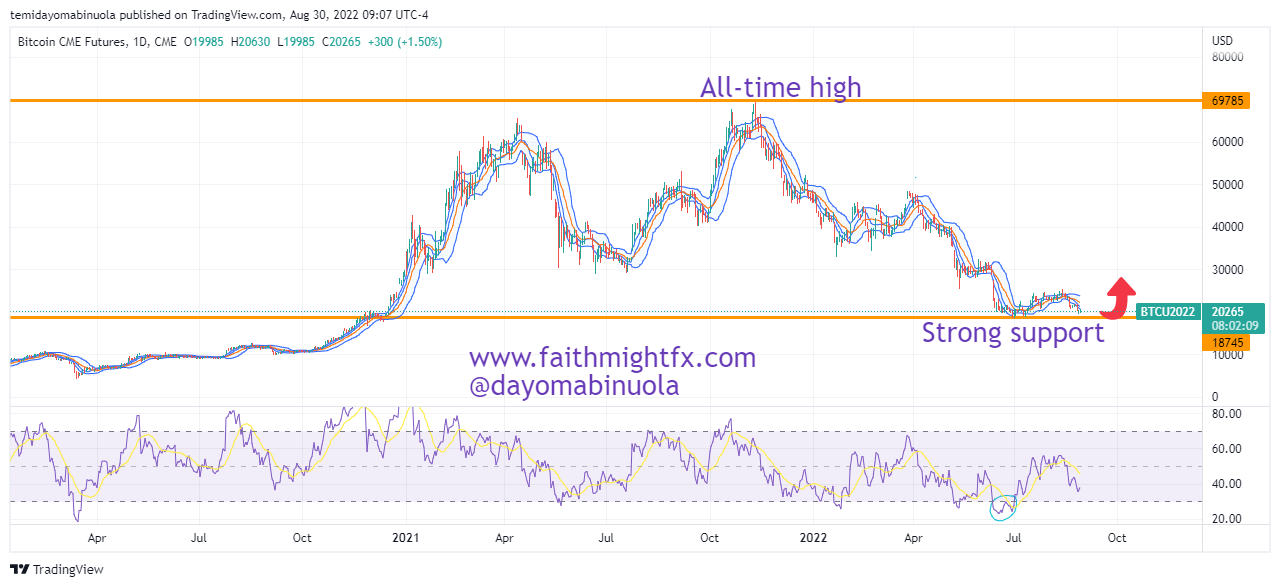
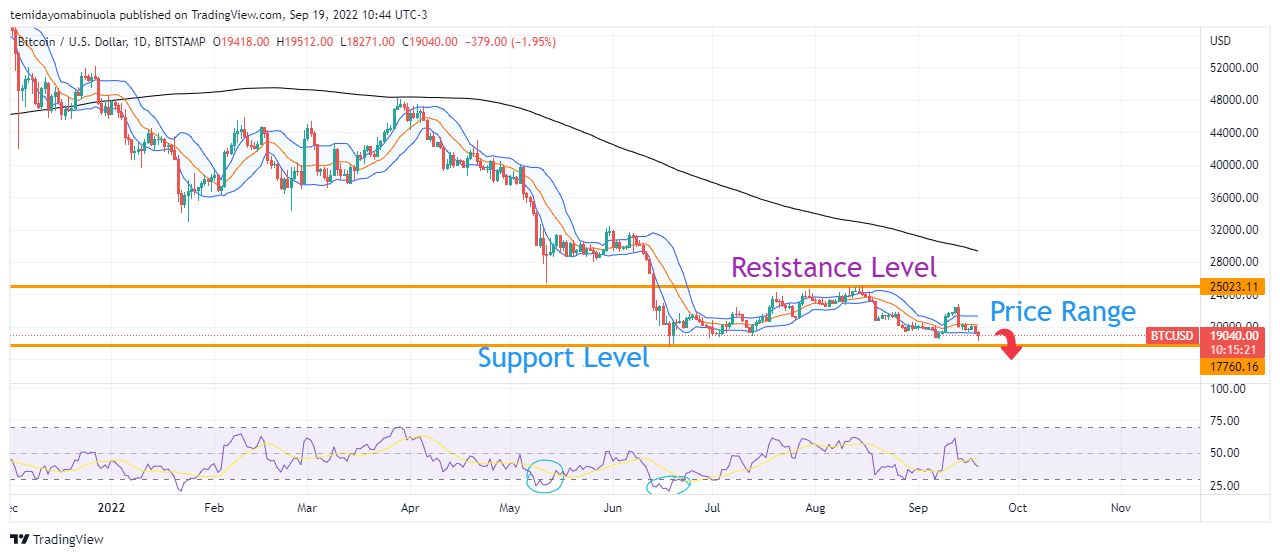
On August 17, 2022 when Bitcoin’s price was around the psychological level of $24,000, we made a forecast that the bears might push price downwards to another psychological level at $20,000. We made this forecast against the backdrop of anticipation of a rally for Bitcoin. On the 27th of August, Bitcoin hit $20K as we had forecasted.
After this $20K mark was hit, the bears still pushed price lower to $18,500. When price hit $18,500, there was a bounce to $22,800. The bounce was not able to mature into a full-blown rally because the bears took back control and price is again below $20,000. As of today, 19th of September 2022, Bitcoin hit a 3-month low of $18,300.
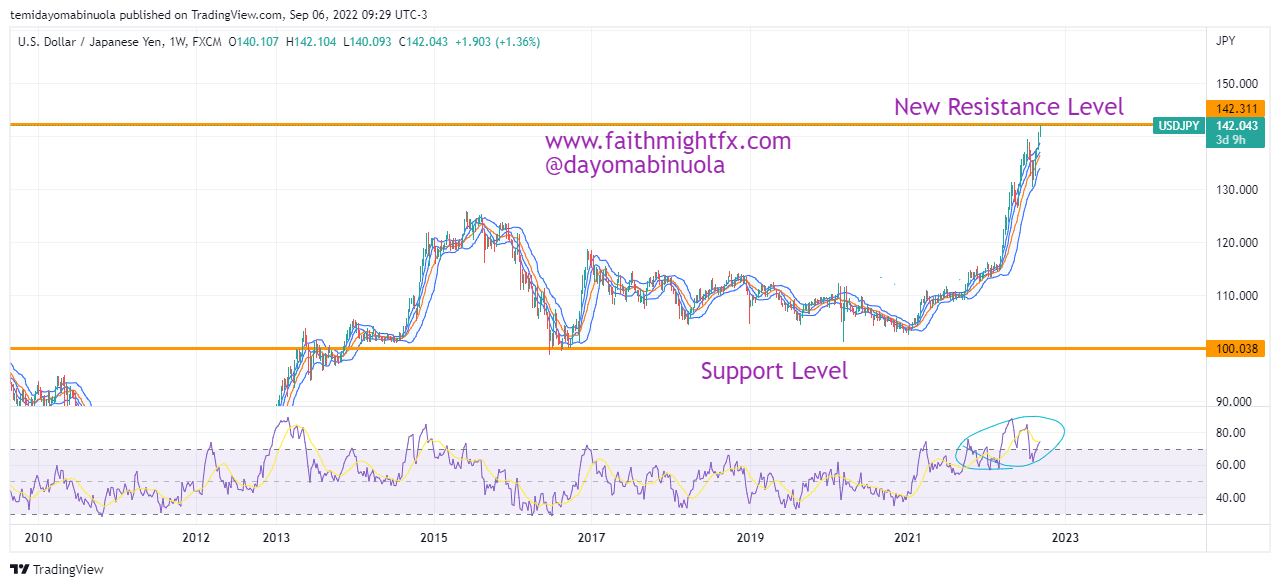
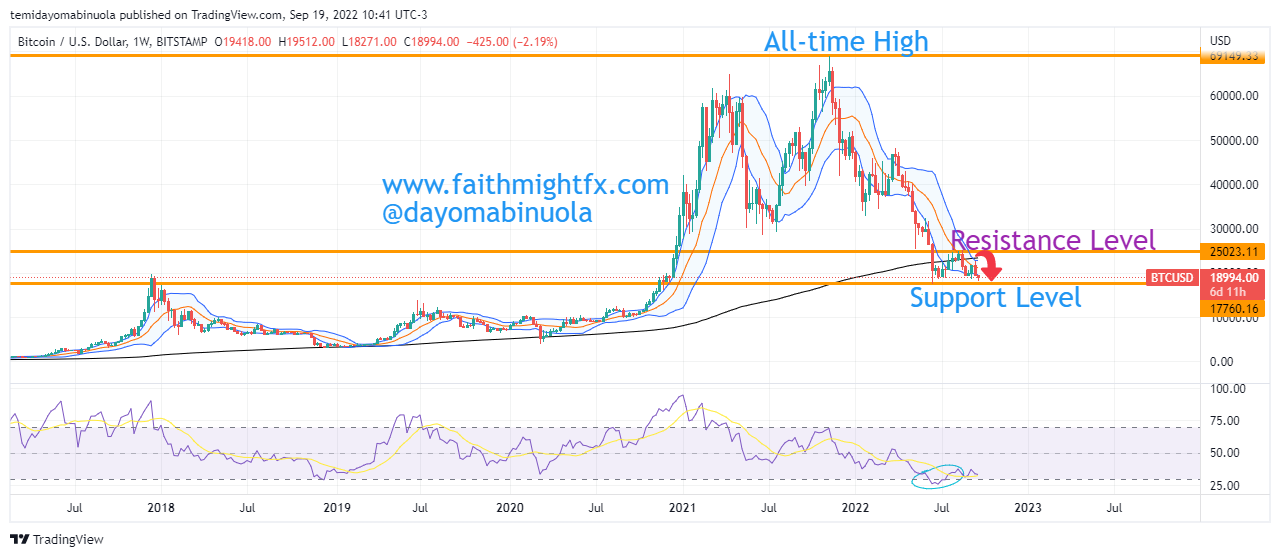
Altogether, it’s been a bearish year for Bitcoin. The current support level for the year is at $17,625. We might be seeing price go below this level in the next few days or at most, two or three weeks from now. If the price of Bitcoin eventually gets to a new low for the year, this might form a major support level for the next bull run to $40,000. On the weekly chart, RSI indicates that price is oversold.
Some of these ideas are in our clients’ portfolios. To understand if this one can work for you or for help to invest your own wealth, talk to our advisors at FM Capital Group. Would you like more information on how to get cryptos in your portfolio? Schedule a meeting with us here